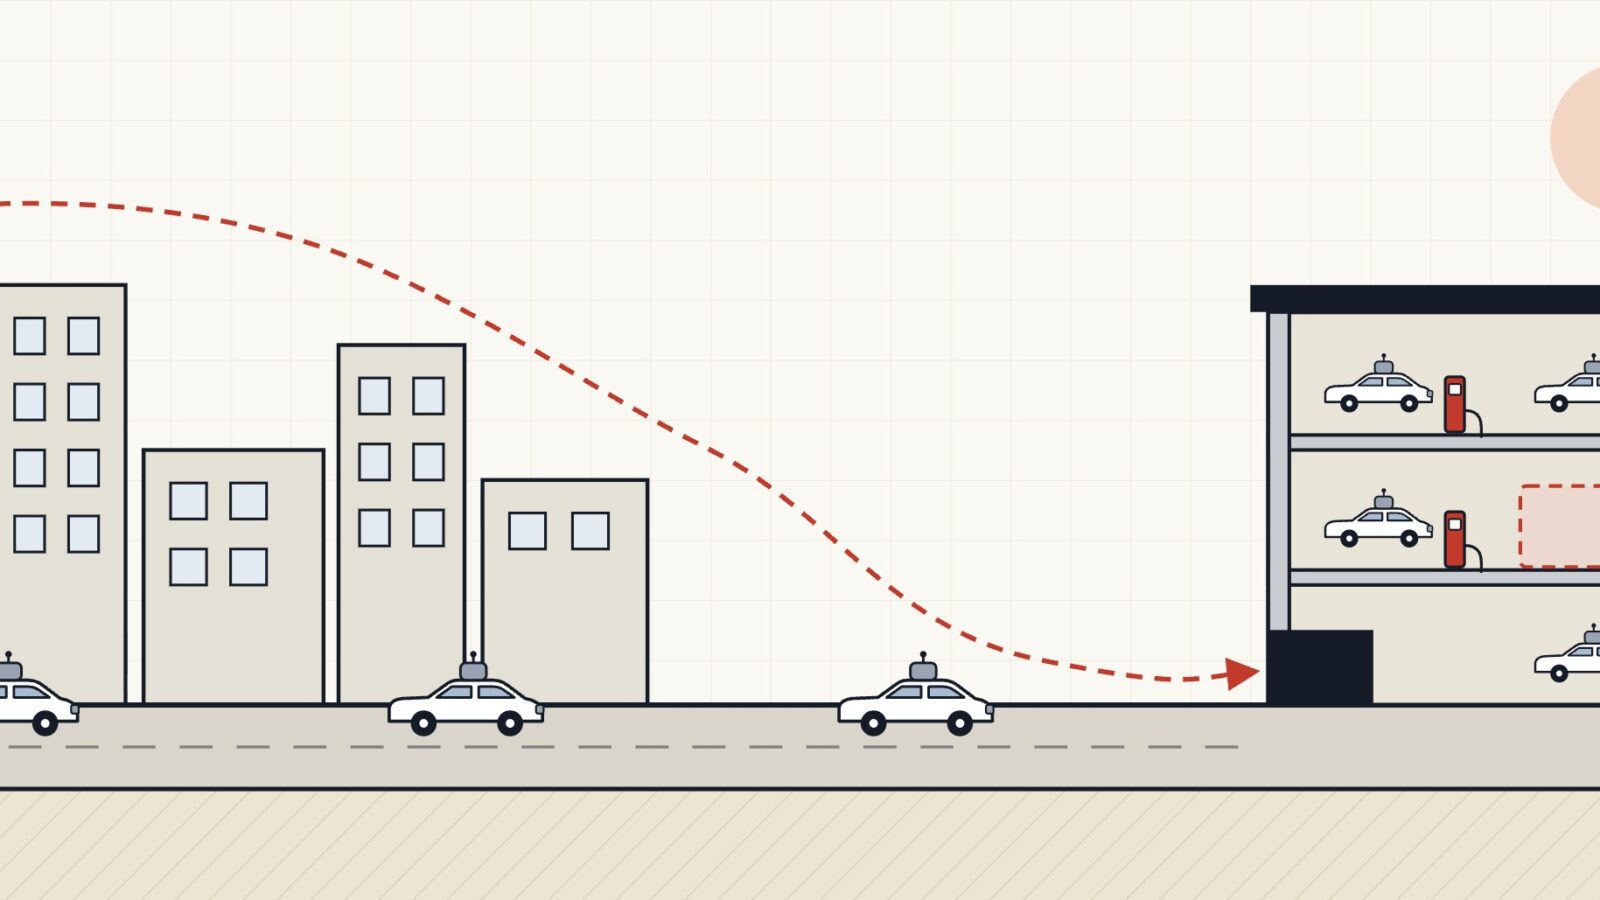
Between the end of March and the end of June 2026, Waymo’s driverless fleet logged about 50 million rider-only miles, an average of roughly 550,000 miles a day, every day, with no one behind the wheel.12
The figure comes from simple subtraction. Waymo’s Safety Impact hub reported 220.6 million cumulative rider-only miles through March 2026 and 271.3 million through June. Waymo’s June totals by city were 92.1 million in Phoenix, 82.4 million in the San Francisco Bay Area, 67.1 million in Los Angeles, 21.1 million in Austin, and 8.6 million in Atlanta.1
Waymo publishes only cumulative totals. Harry Campbell at The Driverless Digest has tracked each quarterly snapshot since mid-2024, and his latest update reconstructs the quarter-by-quarter picture.3 His takeaway: the company’s center of gravity is shifting. Phoenix still leads in cumulative miles but has recorded two consecutive quarterly declines. Los Angeles and San Francisco now each exceed 15 million miles per quarter. Austin’s growth has cooled to about 4 percent quarter over quarter, while Atlanta, the smallest market, grew by roughly 20 percent.
Waymo shares this data to make a safety case. Read it as a parking professional, though, and it becomes something else: a map of where a new class of vehicle will need to wait, charge, and sleep. Anyone who has run a garage knows that every vehicle mile ends somewhere. The question is whose stall it ends in.
Five takeaways.
1. Every mile ends in a stall
A robotaxi fleet doesn’t disappear between trips. Waymo’s own methodology notes acknowledge that its vehicles sometimes wait for the next rider in valid parking spaces: either a marked stall or within 18 inches of the curb.1 Add charging, cleaning, inspection, and repairs, and the real-estate footprint grows with the miles.
That footprint is already evident in leasing data. According to Cushman & Wakefield figures reported by Bisnow, Lyft, Uber, Waymo, and Zoox signed nearly 1 million square feet of industrial leases in 2026, compared with 830,000 square feet over the entire 2022 through 2025 period.4 Their site searches overlap with the parking-heavy and yard-heavy properties that outdoor storage investors already target. Quarterly mileage is the leading indicator of this demand: when a city’s miles climb, a depot search is rarely far behind.
2. Robotaxi growth is concentrating where parking is expensive
Los Angeles and San Francisco now generate the most miles each quarter. Phoenix, the original market and the most parking-abundant of the three, has leveled off.
Here’s a hypothesis worth testing, not a conclusion: robotaxi demand grows fastest where owning and storing a private car is costly. In a metro with plentiful free parking, a driverless ride competes with a car the household already owns and parks for free. In a metro where a monthly parking stall costs nearly as much as a car payment, the math shifts.
The data can’t prove this yet. Phoenix is also Waymo’s oldest market, so the dip could reflect service-area maturity, fleet reallocation to newer cities, or a dozen operational choices invisible from the outside. But if the pattern holds as Denver, San Diego, and other new markets ramp up, it tells operators something useful: the AV customer and the customer facing scarce parking may be the same person.
Every vehicle mile ends somewhere. The question is whose stall it ends in.
Andrew Sachs
3. Miles are not trips, and they are not cars
Campbell is careful to note that rider-only miles are not trips or revenue. Average trip length varies by city, so miles are directional at best.3
They also do not disclose how many vehicles are in each market, which is the number a parking planner actually needs. Systemwide, the arithmetic is suggestive. Electrek put the fleet at roughly 3,500 vehicles in July 2026.5 If that holds for the quarter, each car averaged about 150 miles a day. That is a back-of-the-envelope estimate, not a published figure, but the implication is clear: a robotaxi turns far more miles per stall than a commuter car parked eight hours a day. Fewer stalls per mile, then, but stalls that need power, security and fast turnover.
4. The airport is the first contested ground
Airport runs are among the most valuable trips in ride-hail, and Waymo has steadily moved toward them. It offers curbside service at Phoenix Sky Harbor,6 serves San José Mineta, and began SFO service in January 2026 with pickups and drop-offs at the Rental Car Center, which is connected to the terminals by AirTrain.78
Note where SFO chose to put the robots first: inside a parking and rental car facility. Airports are where public parking revenue, rental car concessions, and AV substitution will first meet and be most visible. The airports that come out ahead will be the ones that design AV staging, hold lots, and charging into their ground transportation plans now, and price that access deliberately rather than discovering the loss in next year’s parking revenue.
5. Watch the distribution layer, and the depot operators
Campbell notes that slowdowns in Austin and Atlanta coincide with both cities being Waymo-on-Uber markets, at a time when that partnership appears to be cooling.3 He is right that it is too early to draw a direct line. But it is a reminder that a robotaxi’s demand depends on who sells the ride, and that layer is shifting.
Meanwhile, the companies operating the physical fleet are becoming a new kind of parking customer. In Nashville, Lyft’s Flexdrive subsidiary built an 80,000-square-foot depot to charge, clean and maintain Waymo vehicles, designed to handle hundreds of cars a day.9
For parking owners, the counterparty of the future is not only the rider. It is the fleet operator. Facilities that can offer powered, secure, after-hours capacity, and a PARCS architecture that credentials a fleet account rather than a paper ticket or a license plate photograph, will be first in line when the depot search reaches their city.
What we still do not know
Waymo does not publish city-level fleet counts, where vehicles wait between trips, how many miles they travel empty, or whether Phoenix’s dip reflects demand or deployment. Each answer would make the parking forecast considerably more precise. The next quarterly update will show whether the shift toward dense, high-cost parking markets is a trend or a blip.
Until then, the rule is simple: follow the miles. The stalls are not far behind.
Sources
- Waymo, Safety Impact data hub, rider-only miles and methodology, data through June 2026. waymo.com
- Gradually.ai, “Robotaxi Statistics 2026,” citing the Waymo Safety Impact hub at 220.6 million miles through March 2026. gradually.ai
- Harry Campbell, “Analyzing Waymo’s City Distribution Using Rider-Only Miles (Update),” The Driverless Digest, Oct. 14, 2026. thedriverlessdigest.com
- CRE Daily, “Robotaxi Firms Lease Nearly 1M SF of Industrial Space in 2026,” citing Cushman & Wakefield data reported by Bisnow, Sept. 2026. credaily.com
- Electrek, “Waymo goes driverless in Las Vegas, four new cities,” July 8, 2026. electrek.co
- The San Francisco Standard, “Phoenix has airport robotaxis. They’re coming to San Jose. San Francisco still waits,” Sept. 5, 2025. sfstandard.com
- KPIX via KION, “Waymo launches robotaxi service to San Francisco International Airport,” 2026. kioncentralcoast.com
- TechCrunch, Waymo begins robotaxi service at SFO, Jan. 29, 2026. techcrunch.com
- WSMV, “Hundreds of self-driving cars coming to Nashville with new Waymo, Lyft facility,” Oct. 2, 2026. wsmv.com
 A