Field Notes • April 2026
500% in 19 Months: The Robotaxi Adoption Curve Just Bent Upward
The California data says San Francisco’s arc is a template for every city next in the rollout queue — and the next curve will be steeper.
Key Takeaways
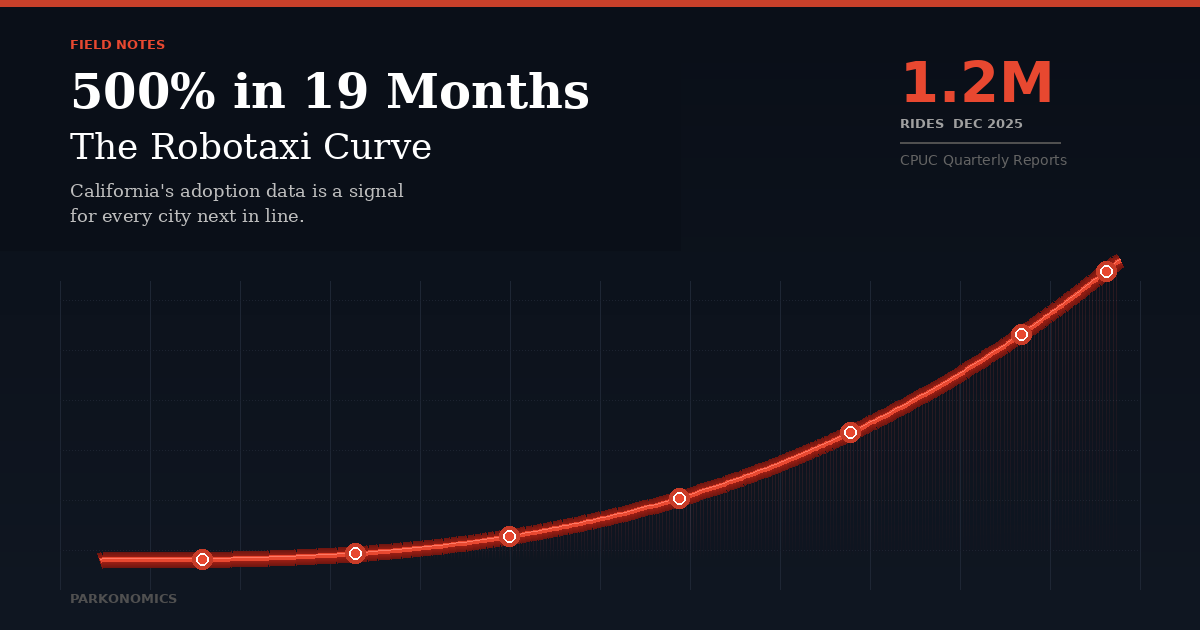
- California robotaxi rides grew 500% in 19 months, from fewer than 200,000 in May 2024 to more than 1.2 million in December 2025 (CPUC-reported).
- Total robotaxi travel distance roughly doubled in 2025 — from 3.8 million kilometers per month to 9.4 million km per month.
- The San Francisco arc (debut, backlash, regulatory settlement, quiet normalization, inflection) is a template, not a cautionary tale. New cities will compress the same cycle.
- For municipal planners, the first pressure points are curb management, parking revenue exposure, and airport pickup/dropoff policy — not garage capacity.
- A practitioner white paper co-authored with the NPA Parking Consultants Council is in development for summer 2026 publication.
California’s robotaxi market just grew 500% in 19 months. That number is an invitation to every city on the rollout map: the operational question isn’t whether this scales in your jurisdiction. It’s how fast, and what you are doing in the 12 to 24 months before it does.
The California Public Utilities Commission released figures showing Californians took more than 1.2 million rides in commercial self-driving cars in December 2025 — up from fewer than 200,000 in May 2024. Total robotaxi travel distance also roughly doubled over 2025 alone, from 3.8 million kilometers per month at the end of 2024 to 9.4 million in December. These are CPUC-reported numbers filed by paid AV operators under mandatory quarterly reporting rules. They are the cleanest signal we have.
I am not here to argue whether this is good or bad for any particular stakeholder. That argument is happening elsewhere. The practitioner question is narrower and more useful: the adoption curve has bent upward, and cities next in the deployment queue should expect their own curves to be steeper and faster than what California’s first markets experienced.
The San Francisco Arc, Compressed
It’s worth remembering where San Francisco was in 2023 and 2024. Hydrant protests. Complaints about emergency response interference. Cars stalling in intersections. A Sacramento fight over local control. If you’d asked most transportation planners in mid-2024 whether robotaxis were going to scale meaningfully in California this decade, the honest answer was “probably, but not soon.”
Then the numbers showed up. The SF robotaxi story isn’t a cautionary tale for other cities. It’s a template. The pattern ran roughly like this:
- Operational debut. Small fleet, limited geofence, constant media attention to every edge case.
- Backlash peak. Local officials demand more control, state and local tensions surface.
- Regulatory settlement. CPUC rules, AB 1777’s remote operator requirement, and standardized reporting solidify the framework.
- Quiet normalization. Ridership builds on top of operational discipline.
- Inflection. The curve bends upward once familiarity compounds.
That cycle took roughly 2.5 years in San Francisco. It will not take 2.5 years in Austin, Atlanta, or in any of the 20-plus cities Waymo has announced on its expansion map. The reasons are structural:
Technology cost curves are falling. Waymo’s 6th-generation Driver uses fewer sensors than the previous generation and deploys in about half the time. The Mesa, Arizona conversion facility can turn a vehicle into a robotaxi in 30 minutes and has capacity for tens of thousands of units per year. Per-vehicle deployment cost is dropping while the addressable fleet is growing.
Familiarity is diffusing nationally, not market by market. A first-time Waymo rider in Phoenix in 2023 was a novelty. A first-time rider in a new city in 2026 has probably already seen footage, read a friend’s review, or ridden once while visiting another market. The “would I get in one?” friction point is eroding at a national level.
Regulatory templates now exist. California’s framework — reporting requirements, stoppage event disclosure, remote operator rules — is a reference architecture that other states are borrowing rather than inventing from scratch. The time from first deployment to stable regulatory footing is shrinking.
Network effects compress the curve. More vehicles in service means shorter wait times, which drives more rides, which justifies more vehicles. A new city entering service in 2026 or 2027 inherits operational playbooks, fleet economics, and rider expectations that San Francisco had to build from zero.
What This Means for Cities Up Next
If you run a municipal transportation office, a parking authority, or a real estate portfolio with meaningful exposure to parking and curb assets in one of the cities next on the rollout map, the question isn’t “will this happen here?” It’s “what am I doing before it does?”
A few things the California data makes clearer than it was two years ago:
- Curb management is the binding constraint, not garage capacity. Robotaxis don’t park long-term. They idle, restage, and re-queue for the next fare. Cities that haven’t inventoried curb supply, pricing, and permitting are setting themselves up to be reactive.
- Parking revenue curves are exposed. Meter revenue, citation revenue, and garage revenue carry different elasticities to AV mode shift, but none of them are zero. Municipalities treating parking revenue as a durable general-fund line item should model the downside case now.
- Airport pickup and dropoff is the first pressure point. Airport trips are the highest-value, most repeatable AV rides. Airport parking demand curves and AV access fee structures should be on the agenda before the first operator opens service, not after.
- Transit complementarity is real, but only if planned. Operators have stated an intent to complement high-capacity transit, not replace it. That happens on purpose, through first-mile/last-mile integration and fare policy, or it doesn’t happen at all.
The CPUC numbers are what they are because California requires detailed quarterly reporting from paid AV operators. A separate Tesla ride service in California operates under a limousine carrier permit rather than an AV permit and is not counted in these figures. For municipal planners, the reporting gap matters: the visible 1.2 million December rides may understate the full volume of AV-style trips moving through curb inventory. The lesson for cities designing their own reporting frameworks is to define the category before the operators do.
Coming This Summer: A Practitioner Guide
I’m co-authoring a practitioner white paper on this topic with Fernando Sanchez of the Parking Consultants Council, on behalf of the National Parking Association. It’s a guide for cities, airport authorities, and parking operators preparing for self-driving taxi deployment — built around curb policy, parking revenue modeling, procurement frameworks, and transit integration. Publication is targeted for summer 2026.
If you’re working on any of this inside a municipality, airport authority, or operator, reach out. We’re collecting field cases now.
The adoption curve isn’t waiting for the planning cycle to catch up.
Sources
- California Public Utilities Commission, quarterly AV operator reports, Q4 2025. cpuc.ca.gov
- Bay City News Service via Mountain View Voice, April 20, 2026.
- Planetizen, April 2026.
- Waymo 2025 Year in Review. The Driverless Digest

Leave a Reply