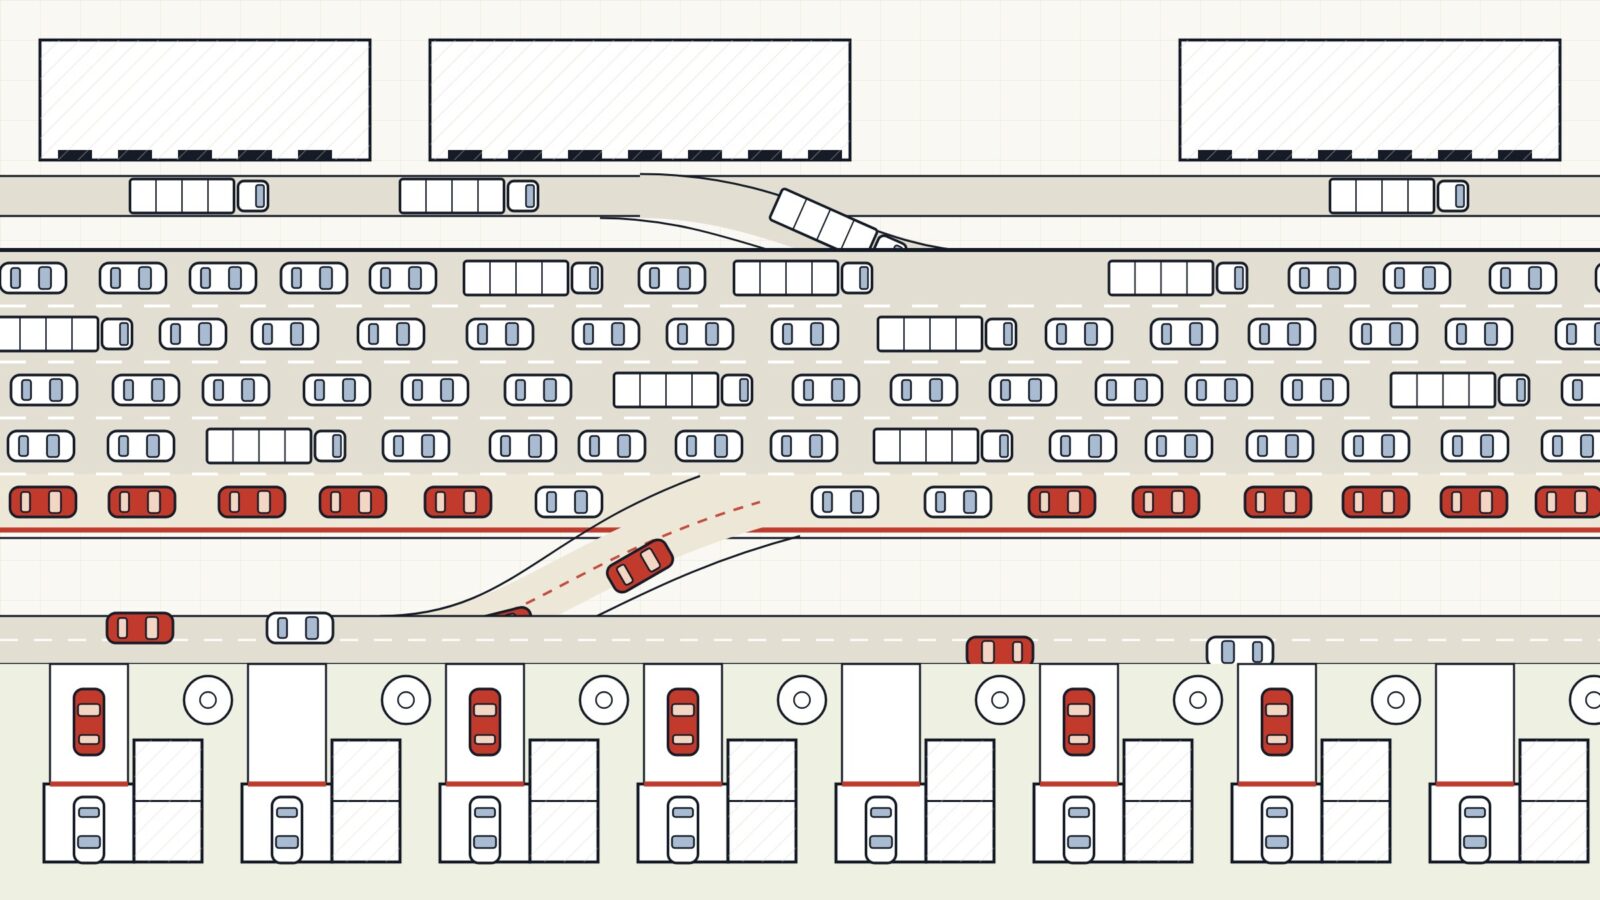
Key Takeaways
- Duranton and Turner found that driving on U.S. interstates rises in almost exact proportion to lane miles: an elasticity of 1.04, confirmed by three independent methods.
- The new traffic is created, not diverted: trucks, households driving more and new residents fill the lane, while traffic pulled off other roads is a small share.
- Fifteen years of follow-up research says the law holds where capacity is unpriced and car ownership is not yet saturated, and weakens where roads are tolled or everyone already owns a car.
- New evidence from Israel shows induced driving runs mainly through households buying another car, and in an American city that decision runs through the parking space.
- Parking supply and price act directly on that ownership margin. Price before you pour, unbundle residential parking, and measure delay rather than volume.
Between 1983 and 2003, the average lane kilometer of interstate highway in an American metropolitan area went from carrying 4,832 vehicles a day to 9,361.1
Twenty years of U.S. interstates, 228 metro areas
Means across metro areas, Highway Performance Monitoring System data as tabulated by Duranton and Turner.1
Read that again. Over twenty years, while the country built about 6 percent more interstate lane kilometers per decade, the traffic on each of those kilometers nearly doubled. We did not build ahead of demand. We did not even keep pace with it. Every lane we added arrived pre-filled.
That number comes from the opening tables of a 2011 paper in the American Economic Review by Gilles Duranton and Matthew Turner, then both at the University of Toronto. Its title is almost aggressively plain: “The Fundamental Law of Road Congestion: Evidence from US Cities.” It has since been cited well over a thousand times. It is quoted at city council meetings, misquoted on social media, and built into California’s environmental review. It may be the most influential piece of transportation economics written this century.
It is also widely misunderstood, including by many of the people who cite it most enthusiastically. And almost nobody has noticed what it implies for parking.
So let us get our geek on.
Why a parking person should care
I have spent most of my working life on the storage end of the trip: owning and operating a 1,300-space garage at Baltimore’s Inner Harbor, designing access and revenue control systems, and consulting on how much parking a building, a campus or a district actually needs. The question I get asked more than any other is some version of “how many spaces?” The honest answer has always contained an uncomfortable recursion: the number of spaces you build changes the number of cars that show up.
Parking professionals know this intuitively. Duranton and Turner proved the highway version of it rigorously. And the research that followed their paper, especially a remarkable study published by the Bank of Israel this year, points straight back at the parking space as the hinge on which the whole law turns.2
To see why, we have to take the paper apart properly.
The claim
The idea is older than the paper. In 1962, the economist Anthony Downs proposed what he called the law of peak-hour expressway congestion: on an urban commuter expressway, peak traffic rises to fill the available capacity. He restated it in his 1992 book Stuck in Traffic.3 For decades it lived as an observation and a slogan.
Duranton and Turner turned it into a number. Their question was simple: if a metropolitan area increases its stock of roads by some percentage, by what percentage does driving on those roads increase? Economists call the answer an elasticity. An elasticity of 0.5 means that 10 percent more lane kilometers produces 5 percent more vehicle kilometers traveled (VKT), so congestion eases. An elasticity of 1.0 means traffic grows in exact proportion to the road, and congestion stays where it was. Above 1.0, new roads make things worse.
Their answer, for interstate highways, was 1.04.
Interactive
Add a lane and watch it fill
Four congested lanes at rush hour. Press Add a lane.
Illustrative model, not a forecast for any road. Traffic grows toward its new equilibrium at the chosen elasticity and settles within about ten years, as Duranton and Turner found; speed follows a standard congestion curve. At 1.0 the speed gain disappears. At 1.3, the range Hsu and Zhang estimated for Japan’s expressways, the road ends up slower than before.1,4
The data
The strength of the paper starts with its data. Earlier induced-demand studies mostly looked at a single corridor, a single state (usually California), or a cluster of East Coast counties. Duranton and Turner used the federal Highway Performance Monitoring System, the dataset states report to the Federal Highway Administration as a condition of highway funding, for every metropolitan area in the continental United States in 1983, 1993 and 2003. That gave them 228 metro areas with interstates in all three years. They layered on the National Personal Transportation Survey’s travel diaries from 1995 and 2001, truck traffic shares, bus fleets, employment, population, climate and terrain.
The metro area is the right unit. As they point out, a new freeway in Buffalo is not going to change driving in Los Angeles; a state is too big a unit and a single road segment is too small.
The most beautiful instruments in transportation economics
How do you prove a road caused the traffic, and not the other way around? You ask an 1849 surveyor.
Here is the difficulty every honest researcher in this field faces. Roads are not assigned to cities at random. Planners build highways where they expect traffic to grow. If you simply observe that cities with more highways have more driving, you cannot tell whether the roads caused the driving or the anticipated driving caused the roads.
Duranton and Turner attacked this three ways, and the fact that all three gave the same answer is the paper’s real power.
First, cross-sectional regressions with heavy controls for population, geography, climate, income and historical population going back to 1920. Elasticity: roughly 0.82 to 0.86 for all metro interstates, and essentially 1.0 for interstates in the urbanized core.
Second, time-series estimates that compare each city only to itself over time, washing out every permanent characteristic of the place. Elasticity: slightly above 1.0, statistically indistinguishable from it. Ten-year first differences landed between 0.93 and 1.05.
Third, and this is where the paper becomes genuinely delightful, instrumental variables. To isolate the part of a city’s highway stock that was not chosen in response to modern traffic, they needed something that predicts where roads are but has no other plausible connection to how much people drive today. They found three:
- The 1947 interstate highway plan, drawn to connect the population and industrial centers of the 1940s and to serve national defense, not to anticipate traffic growth decades later.
- The major railroad routes of 1898, built by private companies for nineteenth-century profit, many of whose rights-of-way later became roads.
- The routes of major exploration expeditions between 1835 and 1850, including surveys searching for passable routes across the Southwest and the Great Basin. Explorers looking for the easy way through the terrain tended to find the same easy way that highway engineers found a century later.
Conditional on historical population and geography, it is hard to imagine how an 1849 surveyor or an 1898 railroad investor could have anticipated 2003 commuting patterns except through the roads their routes eventually became. Using all three instruments together, with the full set of controls, the estimate is 1.04 with a standard error of 0.13.
The estimates
Different methods, the same answer: about one for one
Point estimates with 95 percent confidence intervals (plus or minus 1.96 standard errors) for metro-area interstate VKT. Cross-section and fixed effects with full controls; ten-year changes with geography, history and socioeconomic controls; instrumental estimates with full controls; lane removals are metros that lost more than 5 percent of lane kilometers in a decade. Source: Duranton and Turner (2009 working paper, Tables 2 to 4).1
When three methods that rely on completely different variation in the data converge on the same number, either they are all right or something very strange is going on. The authors made exactly that argument. The economics profession largely accepted it.
One more detail worth savoring: because the instrumental estimates match the ordinary ones, the data suggest that, after controlling for population, America’s interstate lane kilometers were assigned to metro areas more or less without regard to how congested they were. We did not even put the roads where the traffic was.
It is not just interstates
The law extends beyond freeways. For major urban roads, the arterials and collectors that carry most urban traffic, the elasticity was around 0.8 to 0.9. For interstates outside urbanized areas but inside metro boundaries, close to 1.0. That is why the paper’s title says “road congestion” rather than Downs’s narrower “expressway congestion.”
And the law appears to run in reverse. In metro areas where interstate lane kilometers declined by more than 5 percent, traffic fell with an elasticity of about 0.8. Remove capacity and much of the traffic does not simply relocate. It disappears. Traffic engineers call this traffic evaporation, and Duranton and Turner’s data are consistent with it.
Adjustment is also fast. Changes in highways between 1983 and 1993 did not help explain changes in traffic between 1993 and 2003, which implies that driving fully adjusts to a new road network in less than ten years.
Where the new traffic comes from
This is the part of the paper most people skip, and it is the most useful part for practitioners. Duranton and Turner ran an accounting exercise: suppose a metro area adds 10 percent more interstate lane kilometers, producing roughly 10.4 percent more interstate VKT. Who are the new drivers?
The accounting
Who fills a new lane: share of the added interstate traffic
Each bar spans the authors’ lower and upper bounds. Upper bounds sum to the whole increase. Truck traffic rises about 2.3 percent for every 1 percent more interstate. Source: Duranton and Turner, Section 5.1
Two things jump out.
First, trucks are hypersensitive to highway supply. The preferred estimate of the elasticity of truck VKT to interstate lane kilometers is about 2.3. Every new interstate lane is, among other things, a logistics subsidy, and warehousing employment follows it.
Second, and more important conceptually, diversion is small. The common mental model of a new freeway is a bypass that pulls cars off surface streets. The data say that model is mostly wrong. The fundamental law is overwhelmingly about traffic creation, not traffic diversion. The new lane does not relieve the old road. It manufactures new trips.
The demand curve is almost flat
The deepest result is theoretical, and it is the one that matters most for pricing. If the cost of producing road travel has roughly constant returns to scale (double the roads and double the traffic, and conditions stay about the same), then a one-for-one fundamental law is mathematically equivalent to a perfectly elastic demand for driving. In plain terms: at the prevailing time cost of travel, there is a nearly unlimited queue of latent trips waiting for space to open up.
The authors tested this directly using travel diaries, and found that the time cost of driving barely responds to the quantity of driving: an estimated elasticity of about -0.06. The demand curve for urban driving, at the margin, is close to horizontal. Space does not lower the price of a trip much. It just lets more trips happen at the same miserable price.
Interactive
Why more lanes buy more driving, not faster driving
With demand as measured, new lanes move the market sideways.
Schematic after Duranton and Turner’s Figure 1. The flat demand line reflects their estimate that the time cost of driving barely moves as driving grows (elasticity about -0.06). The steep line is shown for contrast only.1
So are new roads worthless?
No, and this is where enthusiastic citers most often go wrong. The authors were careful to say that a high elasticity does not by itself prove a road has low social value. More driving can be valuable driving; people take trips because the trips are worth something to them.
What they actually did was a welfare calculation. Valuing travel time at half the wage and adding fuel costs, they computed an upper bound on the annual benefit of an additional lane kilometer of interstate: about $227,000 a year on average across metros, ranging from under $40,000 in small western cities to $600,000 or more in places like Chicago, San Francisco and Washington. Against that, construction and maintenance costs ran about $519,000 a year per lane kilometer. On average, the cost of an across-the-board highway expansion was more than double its maximum travel benefit.
The welfare math
One more lane kilometer of interstate, per year
Metro-area averages in 2008 dollars. Benefit is an upper bound on travel time and fuel savings without congestion pricing; capital cost annualized at 5 percent. Source: Duranton and Turner, Section 6.1
The conclusion is not “never build.” It is that broad capacity expansion, without pricing, does not pay for itself in time savings. The authors explicitly left room for inexpensive fixes to specific bottlenecks, and for benefits not captured in travel time. Hold onto that caveat. We will need it.
The transit finding
The most debated line in the paper concerns buses. Using bus fleet counts, and instruments for how much transit each metro had built up since the early 1970s, they found that the provision of public transit had no measurable effect on total metropolitan VKT. If you take some drivers off the road and put them on a bus, others take their place. The logic is the same law, running in the other direction: freed-up road space is just capacity, and capacity fills.
Their conclusion was blunt: neither roads nor transit will relieve congestion on their own. What their data did show was that driving is highly responsive to price. Their closing argument, in effect, was a case for congestion pricing.
The new lane does not relieve the old road. It manufactures new trips.
Fifteen years of stress-testing
A good empirical result invites attack. The challenges are where the real insight lives.
The follow-up literature
Five places, five tests of the law
Gauges show each study’s elasticity of driving to road capacity where one is reported; the gold tick marks 1.0, one for one. The Dutch and European studies report effects in other units. Sources:1,4,5,6,2
Japan: even more than one for one
Wen-Tai Hsu and Hongliang Zhang, writing in the Journal of Urban Economics in 2014, studied Japan’s national expressways, using the government’s long-planned expressway extensions as their source of variation. They estimated elasticities between 1.24 and 1.34.4 Their explanation is what they called a coverage effect: a new expressway segment that reaches a place the network previously did not serve generates traffic beyond what the added capacity alone would predict, because it connects new origins and destinations. Extending the network is more potent than widening it.
Europe: the law holds, unless you price
Miquel-Àngel Garcia-López, Ilias Pasidis and Elisabet Viladecans-Marsal took the question to the 545 largest cities in Europe, publishing in the Journal of Economic Geography in 2022. In the long run, highway expansion again caused traffic increases that did not solve congestion. But two findings break from the American paper. Induced demand was considerably smaller in cities with road pricing, and their computations suggest the fundamental law mainly applies to cities where less than about 56 percent of highways are tolled. And unlike Duranton and Turner’s American buses, European rail transit expansion did reduce congestion.5
That is a crucial refinement. The “law” is not a law of physics. It is a law of unpriced capacity.
Los Angeles: transit matters more than the averages say
Michael Anderson of UC Berkeley, in the American Economic Review in 2014, used a natural experiment that Angelenos of a certain age will remember: the 2003 strike by Los Angeles transit workers that abruptly halted bus and rail service. Comparing freeway speeds just before and just after the strike began, he found average peak-hour highway delay rose 47 percent. The effects were largest on freeways running parallel to heavily used transit lines. He estimated the congestion-relief value of the Los Angeles transit system at $1.2 billion to $4.1 billion a year.7
Los Angeles, October 2003: the buses and trains stop
Regression discontinuity around the start of the 2003 strike. Source: Anderson (2014).7
How do we square that with Duranton and Turner’s finding that transit has no effect on VKT? The answer is the most important conceptual point in this entire literature, and it is worth stating slowly:
Vehicle kilometers traveled is not the same thing as congestion.
Anderson’s insight is that transit riders are disproportionately the people who would otherwise be driving on the worst-congested corridors at the worst-congested times. Removing them has an outsized effect on delay. Duranton and Turner measured total driving across a metro over a decade. Anderson measured delay on specific corridors over days. Both can be right at once: transit can sharply reduce delay where it matters most, while the metro’s total driving eventually expands to use the space.
The theorist’s objection
That distinction is the heart of the most pointed critique of the paper. Alex Anas of the University at Buffalo, in a 2024 Journal of Urban Economics article that won the International Transportation Economics Association’s best paper prize, argued that Duranton and Turner’s framework effectively treats the ratio of aggregate traffic to aggregate road length as the measure of congestion, rather than the traditional measure: delay. In a series of theoretical urban models, Anas showed that adding road capacity lowers delay in both the short and long run, even after accounting for induced travel and population growth. Total VKT may still rise, he argued, but that rise reflects the benefit of lower congestion, not its failure.8
Anas’s models, however, assume a world where everyone already owns a car. That assumption turns out to be the key to everything.
The Netherlands: real, measurable, short-run relief
Before we get there, one more empirical piece. Ioulia Ossokina, Jos van Ommeren and Henk van Mourik studied the universe of Dutch highway widenings from 1991 to 2018 using detector-loop microdata, published in the Journal of Economic Geography in 2023. On widened segments, speeds rose about 25 percent and flows rose about 30 percent, over a six-year window. Travel time savings were substantial despite the traffic growth, and the short-run welfare benefits alone covered about 40 percent of the widenings’ costs.6
This is consistent with Duranton and Turner’s own caveat about bottlenecks, and with Anas’s point about delay. Widening a constrained segment of an intercity network produces real relief, at least for a while. It does not produce a free lunch.
Israel, 2026: the mechanism, at last
For fifteen years, the field argued about the size of the elasticity without being able to see inside it. Aggregate data cannot tell you which households responded to a new road, or how.
Gal Amedi, an economist at the Bank of Israel and the Hebrew University, published a discussion paper this year that finally opens the box. Working inside Israel’s Central Bureau of Statistics with linked administrative records covering about 3.2 million adults, roughly two-thirds of the country’s adult population, he matched households to the odometer readings recorded at Israel’s mandatory annual vehicle inspections, and to the lane kilometers of road within ten kilometers of their neighborhoods, from 2015 to 2019.2
His findings rearrange the debate:
- The law is not universal; it scales with density. In rural areas, new road capacity had essentially no effect on driving. In urban neighborhoods, the elasticity was about 0.75. In the densest metropolitan cores, Jerusalem, Tel Aviv, Haifa and Be’er Sheva, his estimates exceed 1.0, meaning new roads there would likely make congestion worse.
- The response is about owning, not driving. Roughly three-quarters of the urban effect came from the extensive margin: households acquiring more cars. Among stable households that kept the same residence and number of cars, the effect on kilometers per car was indistinguishable from zero.
- The marginal household is a young family buying a second car. The response was concentrated among couples around ages 30 to 35, with young children or none yet, at low-to-middle incomes, who already owned one car. New capacity tipped them into owning two.
Inside the elasticity
New roads mostly add cars, not kilometers per car
Neighborhood-level first differences, 2015 to 2019, lane kilometers within 10 km. Margins sum to the total by construction. Under conservative assumptions about unobserved factors, the urban total is at least 0.66. Bank of Israel discussion paper, not yet peer reviewed. Source: Amedi (2026), Tables 3 and 4.2
This reconciles the empirical literature with Anas. In a world where car ownership is universal, the only response available is to drive the cars you have more, and that response is limited; new roads can relieve delay. In a world where ownership is not yet saturated, new roads recruit new car owners, and each new owner brings a full year of driving. That is how you get one for one, or worse.
Amedi offers a provocative corollary. Because U.S. motorization rose from about 658 vehicles per thousand people in 1983 to 795 in 2003 and over 900 by 2023, a rerun of Duranton and Turner on recent American data might find an elasticity below one. That is a hypothesis, not a finding, and he presents it as such. But it reframes the law as a statement about the state of car ownership in a place, not a fixed constant of the universe.
The saturation question
America kept buying cars after the study window closed
Registered vehicles per 1,000 people, as reported by Amedi from NHTSA data; intermediate years not shown. If induced driving runs mainly through new car ownership, the U.S. elasticity should fall as ownership saturates. No one has yet tested that on recent American data.2
And car ownership, in an American city, is a parking decision.
The fundamental law runs through the garage
If induced driving is a household deciding to own another car, the binding constraint is the space where that car sleeps.
Follow the logic one more step. If the dominant channel of induced driving is a household deciding to acquire a car, then the binding constraint on that decision is not the freeway. It is the space where the car sleeps at night.
Nobody buys a second car because the I-405 got a fifth lane. They buy it because the I-405 got a fifth lane and there is somewhere to put it. The road lowers the cost of using the car. The parking space lowers the cost of having one. Amedi’s own model notes that its abstract definition of capacity could include parking space alongside lane width and road quality. The empirical parking literature suggests that is not a footnote. It may be the main event.
What the parking evidence shows
The parking-and-driving literature has the same identification problem as the road literature: people who want to drive choose to live where parking is plentiful. Three studies get around it in different ways.
The San Francisco housing lottery. Adam Millard-Ball, Jeremy West, Nazanin Rezaei and Garima Desai, publishing in Urban Studies in 2022, used the fact that San Francisco’s below-market-rate housing is allocated by lottery. With dozens of applicants per unit, winners tend to take the unit they win, whatever its parking. That makes a building’s parking supply effectively random with respect to the household’s preferences. The result: buildings with at least one parking space per unit had more than twice the car ownership rate of buildings with no parking, and residents drove more and used transit less. Parking availability did not affect employment or job mobility.9
That is as close to a randomized experiment on parking supply as we are likely to get. It is the parking analog of Duranton and Turner’s instruments.
New York’s curb cuts. Rachel Weinberger’s 2012 study in Transport Policy, titled with wonderful dryness “Death by a Thousand Curb-Cuts,” examined neighborhoods in the outer boroughs where off-street parking is possible but scarce. Controlling for transit access and demographics, guaranteed parking at home was associated with a higher share of residents driving to work in the Manhattan core, even though the destination is among the best served by transit on the continent.10 The space at the origin shaped the mode of the commute.
City-scale parking growth. Christopher McCahill, Norman Garrick and colleagues, in a 2015 Transportation Research Record paper, tracked parking supply and automobile commuting over decades in nine mid-sized U.S. cities with relatively stable populations. They applied the Bradford Hill criteria, the framework epidemiologists use to infer causation from observational data. Increases in parking tended to precede increases in auto use, and a majority of the criteria for causation were satisfied.11
The synthesis
Put these findings next to Duranton and Turner and Amedi, and a single picture emerges.
A Parkonomics framework
The ownership valve: how capacity becomes traffic
Conceptual synthesis of Duranton and Turner (2011), Amedi (2026) and the parking studies above, not an estimated model. Flow speed is illustrative.
- Road capacity lowers the cost of a car trip.
- Parking capacity lowers the cost of car ownership, and of the trip’s two ends.
- Where ownership is not saturated, the cheaper the system makes having a car, the more households acquire one.
- Each acquired car generates a full year of driving.
- Unpriced capacity of either kind gets filled.
The parking minimum is, in this light, a mandated capacity expansion delivered at zero price at both ends of nearly every trip. It is the Duranton and Turner experiment run on every parcel in the city at once, for most of a century.
Here is the reframe I would offer the industry. We have tended to see ourselves as downstream of transportation policy: the road network determines how many cars arrive, and our job is to store them. The research says the causality also runs the other way. Parking supply and parking price are among the strongest transportation levers a city has, because they act directly on the ownership margin that drives induced demand. We are not at the end of the pipe. We are at the valve.
We are not at the end of the pipe. We are at the valve.
And the valve can be priced
Duranton and Turner’s demand result has a hopeful twin. If the demand for driving is extremely elastic with respect to its cost, then modest changes in cost move behavior a great deal. That is why pricing works where capacity does not, and why the European cities with substantial tolling escaped the law.
New York has now supplied a large real-world test. In the first year of Manhattan’s congestion pricing program, launched January 5, 2025, the state reported 27 million fewer vehicles entering the zone south of 60th Street, an 11 percent reduction, with crossing times into the zone improving by as much as 51 percent on some routes.12 Independent tallies counted somewhat fewer avoided entries, around 23.7 million, and some ride-hail and taxi data suggested travel speeds inside the zone improved only modestly even as delays on crossings fell.13,14
Manhattan below 60th Street, first year of pricing
State of New York, January 2026. Independent tallies report about 23.7 million fewer entries, and taxi and ride-hail data show smaller speed gains inside the zone than on the crossings.12,13,14
Both readings are consistent with the literature: price reduces entries reliably, and the space it frees inside a dense core is partly refilled by trips that were priced out before. A $9 toll is a blunt, cordon-shaped instrument. The parking meter, the garage rate and the residential permit are finer-grained instruments that touch every trip end, every hour, at every address.
The practitioner playbook
What does a parking consultant, operator, developer or city do differently once they have absorbed this literature? Seven things.
- Treat your demand forecast as an output, not an input. A parking demand study that measures occupancy at sites where parking is abundant and free is measuring the equilibrium that abundance and zero price produced. Building to that number reproduces the equilibrium. Supply partly creates the demand later cited to justify supply. At minimum, every parking study should state the price assumption behind its demand figure, and test what happens to demand at different prices.
- Price before you pour. Concrete is the most expensive way to manage a peak. Dynamic and time-of-day rates, permit pricing and validation reform are the elasticity-friendly tools. The research says demand is highly responsive to price, so the price lever is strong. Use it first, then size structure to the priced demand that remains.
- Unbundle residential parking. The San Francisco lottery is the strongest causal evidence we have that a space at home changes car ownership. Bundling a space into rent hides its price inside the lease and nudges households across the ownership threshold, exactly the margin Amedi identified. Unbundling makes the decision visible.
- Measure delay, not just volume. The Anas critique and the Anderson strike study both teach that throughput and congestion are different quantities. In a garage, a full deck is not a failure; an entry queue spilling into the street is. Instrument facilities for queue length, time to a space and time to exit, not just occupancy. Good PARCS architecture should report the delay metrics, because delay is what customers and cities actually feel.
- Respect the bottleneck exception. Duranton and Turner left room for inexpensive fixes to specific bottlenecks, and the Dutch evidence shows targeted widening can deliver real short-run relief. In our world the analogs are entry and exit lane throughput, payment transaction time, gate cycle speed and the reservoir between the street and the first barrier. Fixing a throughput constraint at the gate is the justified kind of capacity investment: cheap, targeted and aimed at delay rather than at adding stalls.
- Use the elasticity explicitly in planning. California already does. Under SB 743, which shifted the state’s environmental review from vehicle delay to vehicle miles traveled, Caltrans points analysts to the UC Davis National Center for Sustainable Transportation induced travel calculator, which applies an elasticity of 1.0 for interstate lane miles and 0.75 for other highways, numbers drawn straight from this literature.15,16 There is no equivalent standard tool for parking supply. There should be, and the industry is the right group to build it.
- Recognize that the parking ratio is a transportation decision. For developers and municipalities, the number of spaces approved for a project is not only a real estate decision about cost and marketability. It is a decision about how many households in that building will own a second car, and therefore about how much driving the project adds to the network. In high-density places, that is an argument for being honest that lower ratios are a congestion strategy, not merely a cost-saving one.
Try it
Induced travel calculator
Long-run estimate using the elasticity method in the NCST calculator Caltrans uses for SB 743 review: induced VMT equals the elasticity times the percent change in lane miles times existing VMT.15 “Cars’ worth” divides by about 12,500 miles a year per vehicle, an illustrative round figure. Use the official calculator for any real project.
What we still do not know
- Whether the law still holds in America. Duranton and Turner’s data end in 2003. Car ownership is now closer to saturation in most U.S. metros, and Amedi’s model predicts the elasticity falls as ownership saturates. Nobody has published a rerun of the full metro-level analysis on recent data with the same identification strategy. Until someone does, treat 1.0 as the best-documented historical value, not a permanent constant.
- What remote work did to the equation. Peak-hour demand is the whole subject of Downs’s original law. The partial dispersal of the commute since 2020 changes which trips are latent and when they materialize. The literature has not caught up.
- Whether there is a fundamental law of parking. We have strong causal evidence that parking supply raises car ownership and driving. We do not have a clean, metro-scale elasticity of VKT with respect to parking supply, estimated with the rigor Duranton and Turner brought to roads. It is the most important unanswered empirical question in our field, and the data to answer it (assessor records, permit databases, occupancy feeds, registration data) increasingly exist.
- What autonomous vehicles do to the ownership margin. If induced demand runs mainly through the decision to own, a vehicle you can summon without owning, and without a space to store it, could break the mechanism. It could also break it in the wrong direction: a car that circulates empty instead of parking converts storage demand into road demand, and nothing in the fundamental law suggests the road will absorb those zero-occupancy kilometers gracefully. Whether robotaxi adoption dampens the law or supercharges it likely depends, once again, on whether capacity is priced.
- How much refill a priced cordon tolerates. New York’s first year shows fewer entries and faster crossings, with a more muted picture inside the zone. A few more years of data will show how much of the freed space latent demand reclaims, and how high a price has to be to hold the gains.
The lane always fills
The most-quoted version of this research is “you can’t build your way out of congestion.” That is roughly right but slightly lazy. The more precise version, the one fifteen years of evidence supports, is this: in places where people are still deciding whether to own a car, unpriced capacity recruits new drivers until the capacity is used up. Roads do it. Parking does it, probably more directly. Price is the thing that changes the outcome.
For people who run, design, finance and regulate parking, that is not a threat. It is a job description. We control the space at both ends of nearly every trip, and we have the tools to price it intelligently. The lane always fills. The question is whether we decide what fills it.
Frequently asked questions
What is the fundamental law of road congestion?
It is the finding, first proposed by Anthony Downs in 1962 and measured by Gilles Duranton and Matthew Turner in 2011, that driving on a metro area’s major roads rises roughly in proportion to their capacity. Duranton and Turner estimated that 10 percent more interstate lane kilometers produced about 10.4 percent more interstate driving in U.S. cities from 1983 to 2003.
Does widening a highway ever reduce congestion?
Sometimes, and usually for a while. Dutch widenings raised speeds about 25 percent within six years, and targeted fixes to bottlenecks can pay off. Broad, unpriced expansion in places where car ownership is still growing tends to fill back up within about a decade.
Where does induced traffic come from?
Duranton and Turner attributed it mainly to existing households driving more and to commercial and truck traffic, with smaller shares from new residents and almost none from traffic diverted off other roads. Newer Israeli data suggest the largest single channel is households buying another car.
What does induced demand have to do with parking?
If induced driving runs mainly through households acquiring cars, the space to keep a car is part of the capacity that drives it. Randomized housing lottery evidence from San Francisco shows buildings with a parking space per unit have more than twice the car ownership of buildings with none.
Does congestion pricing beat the fundamental law?
The evidence says pricing is the lever that works where capacity does not. European cities with substantial tolling show much smaller induced demand, and New York’s first year of congestion pricing cut vehicles entering the zone by about 11 percent.
Andrew Sachs, PTMP, is president of Gateway Parking Services, a parking consultancy and systems integrator, and co-founder and editor of Parkonomics. He lives in Los Angeles.
Sources
- Gilles Duranton and Matthew A. Turner, “The Fundamental Law of Road Congestion: Evidence from US Cities,” American Economic Review 101(6): 2616 to 2652, 2011. Working paper version: NBER Working Paper 15376, 2009. www.nber.org
- Gal Amedi, “Who Drives the Fundamental Law of Road Congestion?” Bank of Israel Research Department Discussion Paper 2026.03, May 2026. boi.org.il
- Anthony Downs, “The Law of Peak-Hour Expressway Congestion,” Traffic Quarterly 16(3), 1962; and Stuck in Traffic: Coping with Peak-Hour Traffic Congestion, Brookings Institution, 1992.
- Wen-Tai Hsu and Hongliang Zhang, “The Fundamental Law of Highway Congestion Revisited: Evidence from National Expressways in Japan,” Journal of Urban Economics 81: 65 to 76, 2014. econpapers.repec.org
- Miquel-Àngel Garcia-López, Ilias Pasidis and Elisabet Viladecans-Marsal, “Congestion in Highways When Tolls and Railroads Matter: Evidence from European Cities,” Journal of Economic Geography 22(5): 931 to 960, 2022. ideas.repec.org
- Ioulia V. Ossokina, Jos van Ommeren and Henk van Mourik, “Do Highway Widenings Reduce Congestion?” Journal of Economic Geography 23(4): 871 to 900, 2023. tinbergen.nl
- Michael L. Anderson, “Subways, Strikes, and Slowdowns: The Impacts of Public Transit on Traffic Congestion,” American Economic Review 104(9): 2763 to 2796, 2014. www.nber.org
- Alex Anas, “‘Downs’s Law’ Under the Lens of Theory: Roads Lower Congestion and Increase Distance Traveled,” Journal of Urban Economics 139: 103607, 2024. ideas.repec.org
- Adam Millard-Ball, Jeremy West, Nazanin Rezaei and Garima Desai, “What Do Residential Lotteries Show Us About Transportation Choices?” Urban Studies 59(2): 434 to 452, 2022. ideas.repec.org
- Rachel Weinberger, “Death by a Thousand Curb-Cuts: Evidence on the Effect of Minimum Parking Requirements on the Choice to Drive,” Transport Policy 20: 93 to 102, 2012. ideas.repec.org
- Christopher McCahill, Norman Garrick, Carol Atkinson-Palombo and Adam Polinski, “Effects of Parking Provision on Automobile Use in Cities: Inferring Causality,” Transportation Research Record 2543: 159 to 165, 2015. journals.sagepub.com
- Office of the Governor of New York, “Less Traffic, Better Transit: On Its First Anniversary, Governor Hochul Celebrates Transformational Success of Congestion Pricing,” Jan. 5, 2026. www.governor.ny.gov
- Fast Company, “24 million fewer vehicles: One year of congestion pricing in New York City,” Jan. 2026. www.fastcompany.com
- Tribeca Citizen, “Looking back on a year of congestion pricing,” Jan. 5, 2026. tribecacitizen.com
- California Department of Transportation, “Updated Estimates of Induced Travel Demand from Roadway Capacity Expansion,” research notes, 2025 to 2026, on the UC Davis National Center for Sustainable Transportation induced travel calculator. dot.ca.gov
- Elizabeth Deakin and others, “Calculating and Forecasting Induced Vehicle-Miles of Travel Resulting from Highway Projects: Findings and Recommendations from an Expert Panel,” report to Caltrans on SB 743 implementation, 2020. dot.ca.gov
 A