Analysis • Urban Mobility • 2026
New York Priced the Road. Now What Does Los Angeles Do?
A one-year audit of America’s first congestion pricing program — and the uncomfortable questions it raises for every city still pretending the problem will solve itself.
Key Takeaways
- Pricing works: A $9 toll removed 73,000 vehicles daily from Manhattan and accelerated all remaining traffic — including trucks and buses. The demand-reduction effect was real and measurable.
- The transit substitute is not optional: NYC’s ridership gains (+7%) required an existing network capable of absorbing displaced drivers. Cities without that network must build it first.
- Financial architecture is political armor: The existence of MTA bonds secured against toll revenue prevented federal rollback. Build the financial structure before the political opposition mobilizes.
- The doom loop narrative was wrong: Manhattan’s best office leasing year in 23 years, record Broadway revenues, and increased restaurant receipts refute the claim that pricing access destroys economic activity.
- The parking industry is at a structural inflection: Transient parking revenues in the CBD have permanently contracted. The operators building toward fleet management, EV charging, and last-mile logistics are reading the signal correctly.
- Los Angeles has a forcing event: The LA28 Games is a deadline and an opportunity. A successful transportation demand management (TDM) pilot program during the Games creates the public experience that makes lasting road pricing politically viable.
Contents
LA Metro spent years to debate without making any move. New York just won it.
I want to start with something personal. I spent the better part of ten years at LA Metro listening the debate on the subject — internally and openly on public meetings, to former elected officials, stakeholders, constituents, to anyone who would listen — that we needed to fundamentally rethink how we price and prioritize access to our streets and highways. Every time, the political math collapsed. Too many cars. What need to be provide in exchange? Free transit? Not possible. Too many voters who define freedom as the right to drive into a downtown core for free and park cheaply. The discussion always ended the same way: not yet.
New York didn’t wait for “not yet.” On January 5, 2025, the Metropolitan Transportation Authority activated the Central Business District Tolling Program — the first cordon-based congestion pricing scheme in American history. A $9 charge for passenger vehicles entering Manhattan south of 60th Street. And now, twelve months later, we have a verdict.
The verdict is: it worked. The economics are real. The traffic moved. The air got cleaner. The subway filled up. Broadway sold out. The offices leased. And the political opposition — though loud, though persistent, though federally weaponized — could not undo what physics and price signals had already accomplished.
But I’m not writing this as a victory lap for transit advocates. I’m writing it because the real lesson of New York’s first year has almost nothing to do with New York — and everything to do with what cities like Los Angeles are going to do next. We are two years out from hosting the 2028 Olympic Games. We have made $26 billion in infrastructure commitments. And we are still, fundamentally, a region that treats its road space and highway usage as a free good. That’s the conversation I want to have.
1. What the Numbers Actually Say
Let me be rigorous before I get passionate, because the data in Year 1 of the CBDTP deserves serious attention.
Traffic: The Skeptics Were Wrong
The program reduced vehicle entries into the Congestion Relief Zone by approximately 11% — roughly 71,500 to 80,000 fewer vehicles per day competing for Manhattan’s road space. Critics who predicted that a $9 toll would “barely move the needle” were wrong. A $9 charge removed a city the size of Providence from the streets of Lower Manhattan every single day.
But the more interesting story is what happened to the traffic that remained. At the Holland Tunnel — historically one of the most punishing chokepoints in the American urban system — inbound speeds increased by 51%. The Queensboro Bridge improved by 29.3%. Internal speeds within the zone climbed from 8.2 mph to 9.7 mph, a 15% gain. These numbers look modest until you understand the non-linear physics of traffic flow: small reductions in volume at saturation produce disproportionately large gains in speed. New York wasn’t just moving fewer cars. It was moving all of its cars — trucks, buses, emergency vehicles — faster.
One finding I want to highlight specifically for the urban planning community: the Cross Bronx Expressway saw a 7.4% decline in total traffic and a 4.3% drop in trucks. This directly refutes the “traffic displacement” hypothesis that opponents used as their most potent environmental justice argument — the claim that Manhattan’s relief would come at the direct cost of the Bronx. The data says the opposite happened. When you price a resource correctly, people reduce their consumption of it entirely. They don’t just reroute.
CBDTP Year 1 Performance Summary
| Indicator | Pre-Pricing | Year 1 Result |
|---|---|---|
| CBD internal speed | 8.2 mph | 9.7 mph (+15%) |
| Holland Tunnel inbound | Severe gridlock | +51% speed gain |
| Daily vehicle entries | Baseline | -11% (~73,000/day) |
| Transit ridership (all modes) | Baseline | +7% year-over-year |
| PM2.5 air pollution (CRZ) | Baseline | -22% (first 6 months) |
| Broadway ticket sales | Baseline | $1.9B (+23%, record season) |
| Manhattan office leasing | Struggling | Best year in 23 years |
| Net toll revenue (Year 1) | $1B projected | ~$550–600M actual |
Sources: MTA Year 1 Report; NBER Working Paper 33584; Cornell npj Clean Air study (Dec. 2025); NY Governor’s Office six-month and one-year announcements.
Revenue: The Compromise That Worked Anyway
The fiscal picture requires honest handling. Original projections modeled $1 billion in annual revenue against a $15 base toll. The implemented $9 toll — a political compromise secured through Governor Hochul’s intervention in 2024 — generated approximately $550 to $600 million in net revenue in Year 1. A 40% reduction in price point produced roughly a 45% reduction in revenue per projection. That’s not a rounding error; it’s the cost of coalition politics.
And yet. The program still unlocked $15 billion in MTA bonding capacity. Wall Street accepted the lower revenue stream as sufficient to service the debt. Signal modernization on the A and C lines is underway. Second Avenue Subway Phase 2 is capitalized. The operating expense ratio of approximately 18% — higher than the 10–12% typical of mature tolling systems — will compress as E-ZPass penetration increases and the “Tolls by Mail” friction costs normalize.
The MTA adjusted the toll to $9 because it calculated this was the minimum politically survivable price that still satisfied the bond markets. That calculation proved correct. The lesson for planners in other cities isn’t that $9 is the magic number — it’s that you can start lower than the theoretical optimum and still accomplish the structural goal. The “soft launch” principle: begin below optimal to gain public acceptance, then adjust. Los Angeles, Boston, Chicago — take notes.
2. What the Traffic Data Misses — The City That Changed Underneath
I want to spend some time on something the traffic engineers’ reports don’t fully capture: the way a price signal reorganizes a city’s spatial economy.
A $9 toll didn’t just move traffic. It began to undo fifty years of land-use decisions made on the assumption that road space was free.
Consider what happened to commercial real estate. Manhattan had its best office leasing year in 23 years. Vacancy rates fell to approximately 15.5% to 16.1%, the lowest in four years. Commercial leasing was up 80% year-over-year in Q1 2025. The “doom loop” narrative — which posited that the toll would accelerate the flight of businesses to New Jersey — did not materialize. The opposite occurred.
Why? Because the toll restructured the value of location. In a city where road space is free, a car-accessible location at the suburban fringe is nearly competitive with a transit-rich location in the core. When you price road space, you are explicitly repricing the value of proximity to transit. The office buildings next to Grand Central and Penn Station became more valuable. The locations that required a car became relatively less attractive. This is exactly how a healthy land market should respond to a correctly priced transportation system.
The retail story is equally instructive — and more nuanced. Broadway posted its biggest season ever at $1.9 billion in ticket sales. Restaurant reservation data showed a 5% increase in CBD reservations. Sales tax receipts in Manhattan outpaced neighboring counties. But the demographic composition shifted: suburban attendance at Broadway fell to less than 13% of the audience, a 30-year low. The suburban drive-in customer, the one who would park in Midtown and catch a show, largely disappeared.
Their absence was more than compensated by NYC residents using transit and by tourists. This is precisely the substitution effect that congestion pricing theory predicts, and it’s worth sitting with the implications: the regional economy did not depend on that suburban driver to the degree that the political opposition assumed. The city’s economic engine runs on density and proximity, not on accommodating the convenience of those who choose to drive into it.
The Parking Industry at the Inflection Point
For readers of Parkonomics, the structural implications for the parking sector deserve direct treatment. The program’s 11% reduction in vehicle entries was not evenly distributed. The hardest hit was the transient parker — the occasional visitor, the suburban theater-goer, the once-a-month lunch meeting — who pays rack rates and represents the highest-margin customer for off-street garages. Transient garage revenue in the CBD faced estimated contractions of 10–15%.
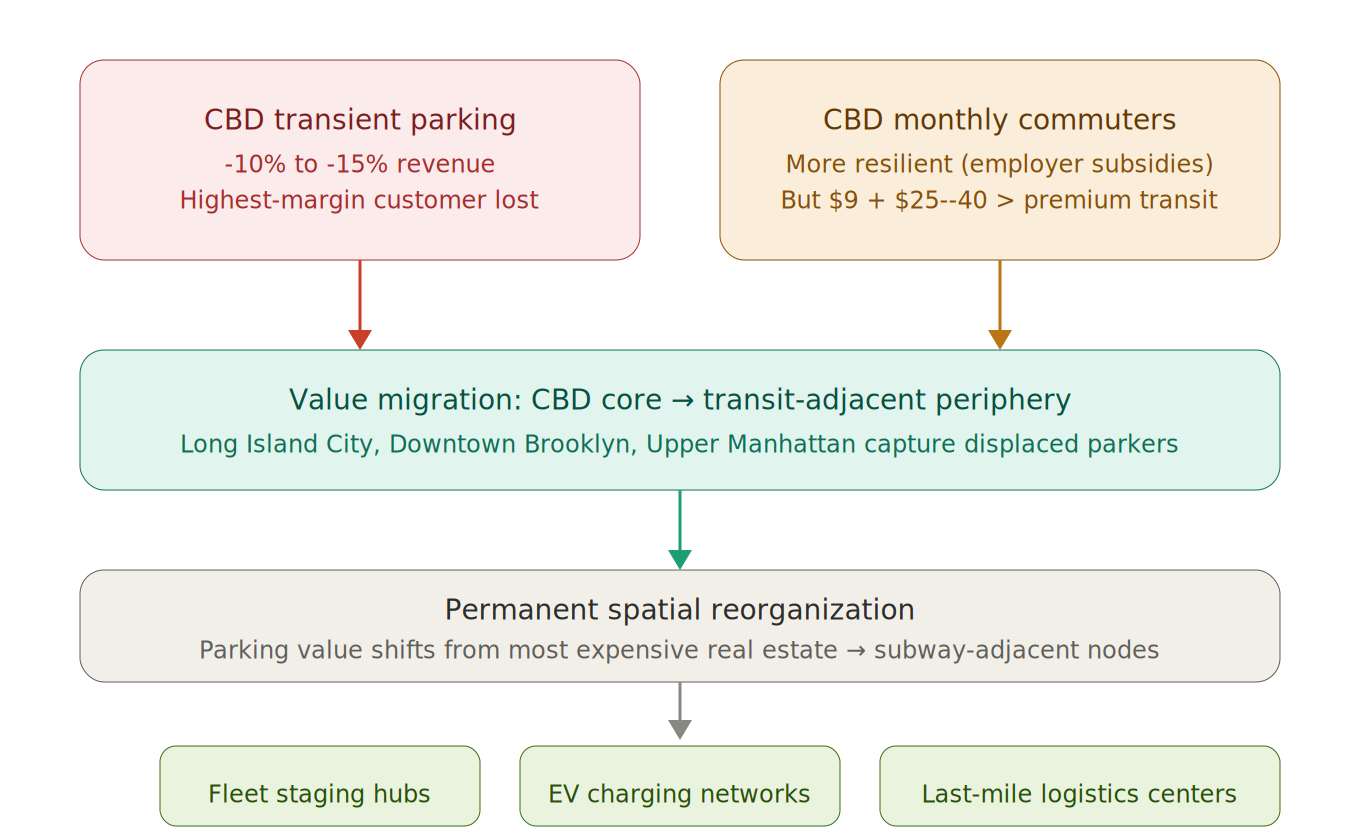
How congestion pricing reorganized where parking value resides
Monthly commuter parkers showed more resilience. These tend to be wealthier drivers with employer subsidies. But the “early bird” segment faced a new calculation: $9 toll plus $25–40 for parking now clearly exceeds the cost of premium transit options. Some portion of that segment is permanently gone.
What emerged to compensate? “Park and ride” behavior at the urban periphery. Garages in Long Island City, Downtown Brooklyn, and Upper Manhattan captured drivers who now park near subway terminals rather than in the core. This is rational spatial reorganization, but it represents a permanent shift in where parking value resides — away from the most expensive real estate in the country and toward transit-adjacent nodes in the outer boroughs.
The more interesting story is what forward-thinking operators are now building toward. The garage of 2030 in Manhattan will not be a passive storage facility for commuter sedans. It will be a fleet staging hub, an EV charging network, a last-mile logistics center. The operators who are already pivoting — converting levels to Amazon delivery staging, installing commercial-grade charging infrastructure, partnering with autonomous vehicle companies — are reading the pricing signal correctly. The ones who are waiting for the toll to go away are misreading both the economics and the politics.
3. The Political Economy — and Why It’s More Important Than the Traffic Data
I want to be direct about something that tends to get sanitized in academic analysis: the political battle over New York’s congestion pricing was not primarily about congestion reduction or increasing city revenue. It was about who gets to redefine and prioritize the use of public right of way.
The incoming Trump administration’s attempt in early 2025 to revoke federal approval for the program — citing technical objections to the environmental review — was transparently political. The MTA had already issued bonds. The cameras were already running. Billions in capital commitments had been made on the basis of federal approvals that were now being retroactively challenged. Courts largely sided with the state, issuing injunctions that kept the gantries active while litigation proceeded. Governor Hochul’s decision to sue rather than capitulate to federal pressure was the moment that determined the program’s survival.
Why does this matter to planners in other cities? Because the legal architecture that protected New York’s program — the existence of issued bonds, the depth of the “arbitrary and capricious” standard for reversing federal approvals, the documented public benefit record — was built over years. It was not improvised. Cities that want to replicate New York’s result need to build similar legal and financial structures before they face political opposition, not after.
The cameras stayed on because the bonds had already been sold. Financial architecture is political armor.
The New Jersey dimension illustrates a second political reality: regional equity arguments are powerful, and they need to be addressed head-on, not dismissed. NJ Transit carried a disproportionate burden of displaced drivers without receiving toll revenue. The argument that New Jersey commuters were paying for New York’s subways while their own system deteriorated was genuinely compelling — and was only weakened when the air quality data showed improvements on the New Jersey side of the Hudson, not degradation. Data matters. But so does the institutional arrangement. A more equitable revenue-sharing structure between the MTA and NJ Transit would have significantly reduced the political friction and the legal exposure.
I raise this not to relitigate New York’s choices but because the Los Angeles context presents analogous regional equity challenges. A congestion pricing zone centered on downtown LA would inevitably impose costs on commuters from the San Fernando Valley, the Inland Empire, and the South Bay who lack viable transit alternatives. That is not an abstraction. That is a political veto waiting to happen unless the program design explicitly addresses it.
4. From Where I Sit — What Los Angeles Needs to Understand
Now I moved from Los Angeles to Santa Barbara not because I gave up on Los Angeles, but because what I can do for the region is looking at it with an objective perspective and hopefully able to help build the intellectual framework that makes the next policy intervention survivable.
New York’s Year 1 data is the most important evidence base we have ever had for the congestion pricing argument in the United States. It resolves, empirically, questions that were previously theoretical. Demand is elastic. The city’s economy does not collapse. Air quality improves. Transit ridership grows. The parking industry adapts. The political opposition fades as the benefits become tangible.
But Los Angeles is not New York. I want to be honest about what that means.
The Transit Substitute Problem
New York’s congestion pricing works in part because New York has a transit system capable of absorbing displaced drivers. Moreover, New Yorkers are more adaptive to use transit as their mobility option, freedom still exist without their cars. The subway added 7% ridership system-wide. LIRR saw 9% gains. Metro-North 6%. When you price people off the road, they need somewhere to go — and New York had somewhere to send them.
Los Angeles does not have that system yet. We have Metro Rail, and it is improving. We have the K Line, the E Line extensions, the ongoing work on the Regional Connector. But our transit network reaches a fraction of the destinations that drive car trips in this region. A cordon pricing zone around downtown LA would strand workers from communities that have no viable transit alternative. That is not a political objection. It is a sequencing requirement: transit investment has to precede or accompany congestion pricing, not follow it.
This is where the 2028 Olympics creates a genuine strategic opportunity. We have committed to infrastructure investment at a scale and timeline that does not typically occur outside of crisis. The question is whether we use that window to build the transit-first sequencing that makes pricing politically and practically viable in the 2030s — or whether we build point-to-point for the LA28 Games infrastructure that solves 17 days of Olympic and 13 days of Paralympic athletics and creates nothing durable for the 4 million daily commuters who follow.
The Scale of the Comparison
New York removed roughly 73,000 vehicles per day from its central business district. Los Angeles’s daily vehicle miles traveled exceed 70 million across the entire basin. The geometry of the problem is different by an order of magnitude. A Manhattan-style cordon — a single geographic boundary protecting a dense downtown core — does not translate directly to a sprawling polycentric metropolis where Burbank is a job center, El Segundo is a job center, Century City is a job center, and Long Beach is a job center.
What Los Angeles may need instead is a network pricing model: variable tolls on freeways and arterials calibrated to demand, rather than a single cordon around one downtown. This is technically more complex, politically more exposed, and administratively more challenging. It is also, in my assessment, the only approach that can meaningfully address congestion at the regional scale that LA demands.
New York proved the mechanism works. Los Angeles has to invent the geometry.
The Equity Architecture
The most important design question for any LA congestion pricing program is not the toll level or the zone boundary. It is the equity architecture. Who is exempted? Who receives credits or rebates? How does the revenue flow back to the communities that absorb the greatest burden?
New York’s 80/10/10 lockbox — 80% to NYC Transit, 10% to LIRR, 10% to Metro-North — was politically essential. It answered the question “what is this money for?” before opponents could fill that vacuum with their own answer. Los Angeles will need an equivalent structure, and the equity component will need to be more explicit. A meaningful portion of any congestion revenue should flow directly to transit improvements in the communities most affected by the pricing — not as a political gesture but as a structural requirement.
The South Bronx story is instructive here. Environmental justice advocates who feared that the congestion pricing would push traffic into already-overburdened neighborhoods were proven wrong by the data. But the fact that they were proven wrong does not mean their concern was unreasonable. It means the program was designed well enough, and implemented at a sufficient toll level, to reduce vehicle trips rather than merely redirect them. The design has to earn that result. It cannot be assumed.
5. The National Conversation Has Changed
One year ago, American urban planners debating congestion pricing were arguing from European data — London, Stockholm, Milan, Singapore. We were asking skeptics to believe that what worked in those cities could work in the United States, with its different political culture, its car dependency, its weaker transit traditions.
We no longer have to make that argument. New York has made it for us.
Boston’s Joint Committee on Transportation is now actively discussing the mechanism. Cornell researchers are modeling the air quality benefits for Boston, Los Angeles, and Chicago as we speak. The Brookings Institution has published a “blueprint” framework for other cities to follow New York’s implementation approach. The conversation has moved from “is it possible” to “how do we do it.”
That is a seismic shift. I have been in rooms where the political viability of congestion pricing in American cities was genuinely questioned by serious people. I am no longer in those rooms. The question now is not whether American cities will implement road pricing — it is which cities will move first and build the template for the others to follow.
Los Angeles has needs to implement congestion pricing. The only question is whether we do it before or after we prove, at the LA28 Games, that we cannot manage demand without it.
Los Angeles has an opportunity that is not available to Boston or Chicago: we have a forcing event. The LA28 Games will create a 30-day pressure test of our transportation system at a scale and visibility that is unprecedented. Every traffic management success and every failure will be broadcast globally. Every decision we make now about infrastructure investment, transit coverage, and pricing mechanisms will be evaluated against that deadline.
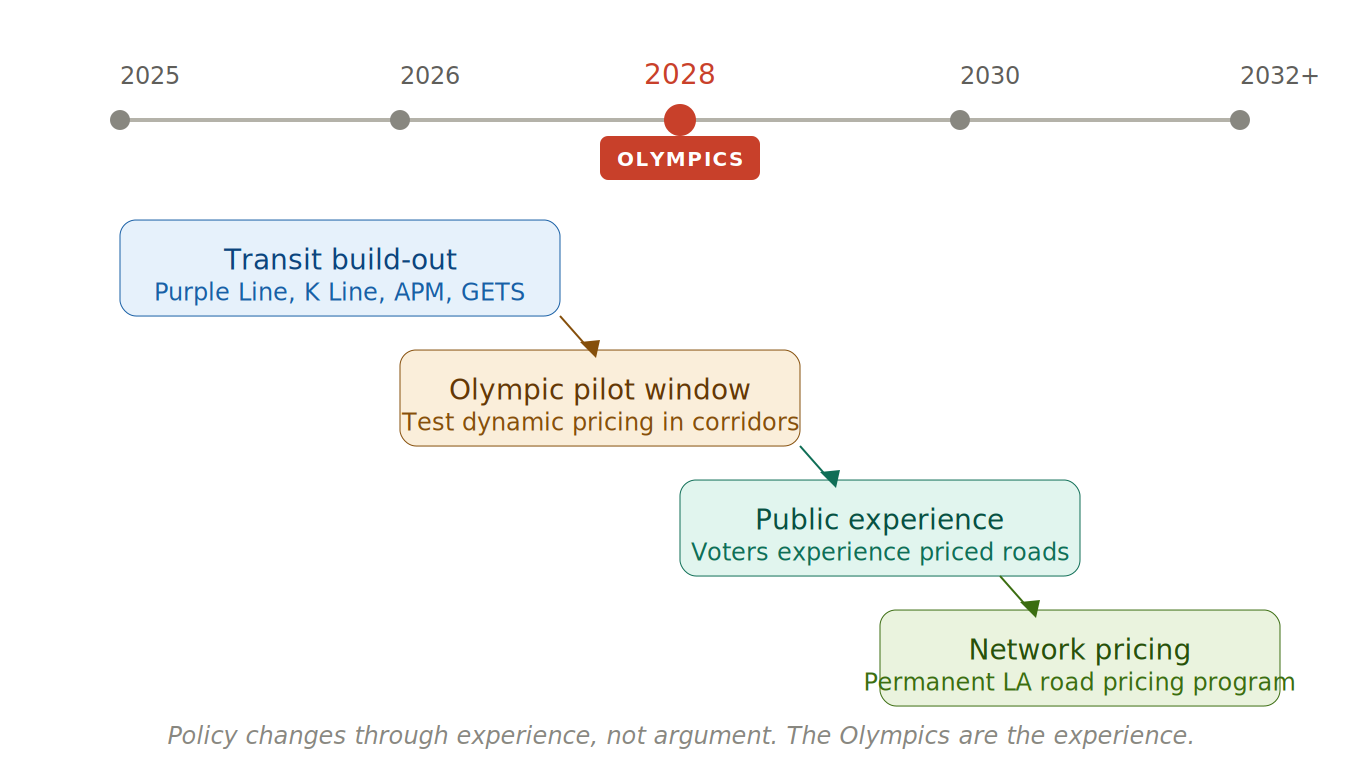
The sequencing opportunity: from Olympic pilot to permanent network pricing
If we use the Olympic period to pilot, test, and normalize dynamic road pricing — even at limited scale, even in a single corridor — we will have done something that New York took a decade to accomplish politically: we will have given the public an experience of what pricing does to traffic flow. People who experience the benefit of a priced road during the LA28 Games will be different voters in 2029 than they are today.
That is how policy changes. Not through argument. Through experience.
Conclusion: The Price of Waiting
I want to close with a number that does not appear in the Year 1 CBDTP data, because it cannot be measured in a single city in a single year.
The Texas A&M Transportation Institute estimates that congestion costs the United States $269 billion annually — in time, in fuel, in economic productivity incinerated in idling engines. That figure compounds every year we delay pricing the road correctly. It is absorbed disproportionately by workers who cannot afford to live near their jobs, by logistics companies who pass the cost downstream to consumers who are already stretched, by cities whose infrastructure deteriorates faster than it can be maintained because the revenue to fix it was never collected.
New York’s $9 toll recovered approximately $550 million in Year 1 — and, more importantly, proved that a major American city could implement road pricing, survive the political assault, and come out stronger on the other side. It demonstrated that demand is elastic. That the economy does not collapse. That the air gets cleaner. That the trains fill up.
The price of waiting is not abstract. It is paid every morning, in every city, by everyone who sits in traffic they didn’t have to sit in — because we have been unwilling to tell the truth about what road space costs.
New York told the truth. Now it’s our turn.
Selected Sources
- NY Governor’s Office. “Less Traffic, Better Transit: On Its First Anniversary.” January 2026.
- MTA Year 1 Performance Data. Metropolitan Transportation Authority, New York.
- Cook, C., Kreidieh, S., Vasserman, S. et al. “The Short-Run Effects of Congestion Pricing in New York City.” NBER Working Paper 33584, March 2025.
- Cornell University / npj Clean Air. PM2.5 reduction study. December 2025.
- Regional Plan Association. “Congestion Pricing One Year Later.” 2026.
- Brookings Metro. “Will New York’s Congestion Pricing Pave the Way for Broader Adoption?” 2025.
- Texas A&M Transportation Institute. 2025 Urban Mobility Report.
- NY Governor’s Office. Six-Month Report. July 2025.
- Savills / CBRE. Manhattan Office Reports, Q4 2025.
Leave a Reply