5-Part Series • Olympic Economics • Part 2 of 5
The 2028 Los Angeles Olympics: Infrastructure, Transit, and the $26 Billion Bet • Part 2 of 5: The Losers’ Bracket | ← Part 1
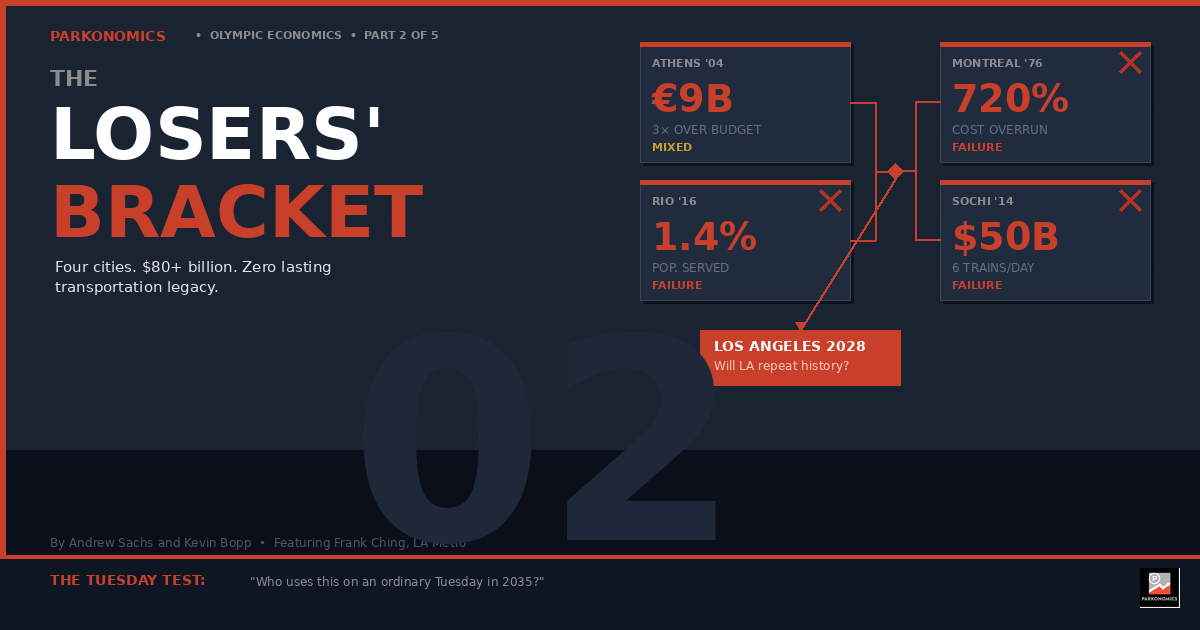
The Losers’ Bracket: What Athens, Rio, Montreal, and Sochi Teach Us About Olympic Transportation Failure
Four cities spent a combined $80+ billion on Olympic infrastructure. Here’s the mobility economics autopsy of what went wrong — and why LA is at risk of repeating every mistake.
Key Takeaways
- Olympic transportation investments succeed or fail based on four criteria: network effects, demand matching, operational sustainability, and opportunity cost. Every failed city violated at least one. The worst — Sochi — violated all four simultaneously.
- Athens built excellent transit infrastructure that still serves 1.56 million daily riders. It also built sporting venues that now sit abandoned. The transit works because it serves demand that existed before the Olympics and continued after. The venues served 17 days.
- Rio’s TransOlimpica BRT connected Olympic venues, not population centers. Only 1.4% of Rio’s population lives within 1 kilometer of stations. Ridership hit 25,000 daily against a 70,000 projection. Today, 46 stations are shuttered and only 120 buses remain operational.
- Montreal sacrificed $2.8 billion in planned transportation improvements — Metro extensions, highway upgrades, airport modernization — to cover stadium cost overruns. The debt took 30 years to repay. The Metro extensions that were abandoned in 1976 weren’t completed until the 2000s.
- Sochi spent $8.3–10 billion on a railway that now runs six trains per day, requiring $1.2 billion in annual subsidies — the highest per-kilometer rail construction cost in the world, for infrastructure that serves almost no one.
- The diagnostic question that separates success from failure: who uses this on an ordinary Tuesday in 2035? LA’s permanent rail investments pass this test. The bus surge, temporary lanes, and event-specific infrastructure do not — unless there is a plan to convert them to permanent service.
Table of Contents
- The Taxonomy of Failure
- Athens 2004: The Bifurcated Legacy
- Rio 2016: Building for the Wrong People
- Montreal 1976: The 30-Year Mortgage
- Sochi 2014: Infrastructure Without Demand
- The Common Thread: Spectacle vs. Service
- What This Means for LA
- The Warning Signs
- The Counterfactual Question
- From Failure Analysis to Accountability Framework
The Taxonomy of Failure
Not all Olympic failures are created equal.
This is the first lesson from the examination of the wreckage of Athens 2004, Rio 2016, Montreal 1976, and Sochi 2014. Each city failed in different ways, and those differences are enormously important for understanding LA’s risk profile. Some cities built infrastructure that served no one. Others built infrastructure that served the wrong people. Still others built the right infrastructure but couldn’t maintain it. And a few managed to fail in multiple categories simultaneously.
Before we dissect each case, let’s establish the analytical framework. In mobility economics, transportation investments succeed or fail based on four criteria:
1) Network Effects: Does the investment connect to existing infrastructure and population centers, or does it stand alone?
2) Demand Matching: Does the investment serve genuine, sustained travel demand, or does it serve event spectacle?
3) Operational Sustainability: Can the investment be maintained at a reasonable cost after the event ends?
4) Opportunity Cost: What else could have been built with the same resources?
Every Olympic transportation failure that we examine violates at least one of these principles. The worst failures violate all four.
But there’s a dimension missing from this analytical framework: accountability. Failed Olympic transportation investments don’t just happen. They result from specific decisions by specific people who could have decided otherwise. Rio’s TransOlimpica didn’t build itself along the wrong route — someone chose that route. Montreal’s stadium didn’t cannibalize transportation funding autonomously — politicians made that tradeoff.
As we examine each failure case, we’ll identify not just what went wrong mechanically, but who made the decisions that led to failure. This matters for LA because the region faces analogous decision points. Understanding who failed elsewhere helps identify who must succeed here.
Athens 2004: The Bifurcated Legacy
Athens presents the most intellectually interesting failure because it is, paradoxically, also a partial success in at least one critical sense.
The 2004 Games cost approximately €9 billion — roughly three times the initial estimate. The Greek government invested heavily in transportation: two new metro lines, a suburban railway, a tram network, a new airport, and the Attiki Odos ring road. These investments were genuine, permanent, and well-designed.
Here’s the paradox: the transportation infrastructure worked.
The Athens Metro now serves 1.4 million daily passengers. The suburban railway connects the airport to the city center. The tram carries 65,000 daily riders. The Attiki Odos removed an estimated 375,000 cars from surface streets. By any reasonable measure, the transit investments were successful.
So why does Athens appear in every list of Olympic disasters?
Because the sporting venues were catastrophic white elephants. The Olympic canoe/kayak center sits abandoned. The beach volleyball stadium is overgrown. The softball venue has been vandalized. The former IOC President Jacques Rogge estimated that 2–3% of Greek sovereign debt — tens of billions of euros in interest payments over decades — was attributable to Olympic costs.[1]
The Mobility Economics Lesson: Athens violated the operational sustainability principle, but only for non-transportation infrastructure. The transit investments succeeded because they served genuine demand that existed before the Olympics and continued afterward. The sporting venues failed because they served demand that existed for 17 days and then vanished.
The critical variable was economic context. When Greece entered its debt crisis in 2009, the government had to make triage decisions. Transit infrastructure was essential — people needed to get to work. Olympic venues were not essential — nobody needed to practice kayak slalom. The metro survived; the canoe center decayed.
The Decisions That Determined Destiny
Athens’s bifurcated legacy didn’t happen by accident. It resulted from specific decisions:
The Greek government chose to build elaborate single-use sporting venues when existing facilities could have been upgraded. Post-Games, the government chose to defer maintenance on Olympic facilities rather than demolish them or convert them to other uses. Transit investments received sustained funding because daily riders created political pressure; empty stadiums had no constituency.
The lesson for LA: political constituencies determine long-term investment. Infrastructure that creates daily users creates political pressure for maintenance. Infrastructure that serves occasional spectacle has no defender when budgets tighten.
LA’s Risk Factor: Low for transit, potentially high for non-transit investments. LA’s “no-build” philosophy for sporting venues is explicitly designed to avoid the Athens trap. The risk is in temporary infrastructure — staging depots, bus surge capacity, temporary lanes — that may not convert to permanent value.
Rio 2016: Building for the Wrong People
If Athens is a story of good infrastructure undone by bad fiscal context, Rio is a story of bad infrastructure that was doomed from the start.
The centerpiece of Rio’s Olympic transportation strategy was an aggressive expansion of Bus Rapid Transit (BRT). Brazil had pioneered BRT in Curitiba, and Rio planned to replicate that success with four new corridors: TransCarioca, TransOeste, TransOlimpica, and TransBrasil. The theory was sound: BRT offers metro-like capacity at a fraction of the cost, with dedicated lanes, level boarding, and signal priority.
The execution was a disaster.
Let’s focus on the TransOlimpica, the corridor most directly tied to the Games. It was designed to connect the Deodoro sports complex to Barra da Tijuca, where the Olympic Park was located. The route made sense for moving athletes and spectators during the Games. It made almost no sense for moving actual Brazilians afterward.
The Institute for Transportation and Development Policy (ITDP) calculated that only 1.4% of Rio’s population lives within 1 kilometer of TransOlimpica stations.[4] The corridor was projected to carry 70,000 daily passengers. Actual ridership: approximately 25,000. Today, 46 stations across Rio’s BRT network are shuttered due to vandalism and deferred maintenance. Only 120 buses remain operational across the system.
Christopher Gaffney, a geographer at the University of Zurich who has extensively studied Rio’s Olympic legacy, offered the definitive verdict: the new highways were retrograde, and it would have been better to expand Rio’s metro system to densely populated areas.[5]
The Mobility Economics Lesson: Rio violated the demand matching principle catastrophically. TransOlimpica connected Olympic venues, not population centers. It served the needs of the organizing committee, not the needs of Rio’s residents. The moment the Games ended, the rationale for the corridor evaporated.
Worse, Rio violated the opportunity cost principle. The resources spent on TransOlimpica could have extended the metro system — a mode that Cariocas actually use — into underserved communities. Instead, as Gaffney noted, the BRT corridors were designed to bring poor, relatively immobile people to Barra to work for the expanding upper-middle class. This was infrastructure for real estate speculation, not urban mobility.
Who Decided to Build TransOlimpica?
Rio’s TransOlimpica corridor wasn’t an accident. It was a deliberate choice by specific actors. Mayor Eduardo Paes championed BRT over metro expansion, claiming it offered better cost-efficiency. The route was designed to serve the Olympic Park in Barra da Tijuca — a wealthy enclave distant from Rio’s population centers. Real estate developers with land holdings along the corridor lobbied aggressively for the alignment. Rider advocacy groups and urban planners warned that the corridor wouldn’t serve actual demand. They were ignored.
The lesson for LA: Olympic transportation decisions reflect power, not just planning. The coalitions that form around these investments determine whose needs get served. LA faces analogous choices — particularly about whether Inglewood’s replacement “bus-based approach” will serve Inglewood residents or merely shuttle event attendees.
LA’s Risk Factor: Moderate. LA’s transit investments are concentrated in genuinely high-demand corridors — the Wilshire Corridor is the densest transit market in the western United States. But the bus surge strategy raises questions: if Metro is borrowing thousands of buses to serve Olympic-specific routes, do those routes serve permanent demand? Or are they TransOlimpica redux — infrastructure designed for 17 days of spectacle?
Montreal 1976: The 30-Year Mortgage
“The Olympics can no more have a deficit than a man can have a baby.” — Mayor Jean Drapeau, Montreal, 1970
Mayor Jean Drapeau’s infamous declaration has become the founding text of Olympic economics skepticism. Montreal’s Games ultimately cost CAD $1.6 billion against an original budget of CAD $134 million — a 720% overrun that remained the worst in Olympic history until Sochi. The debt was not fully repaid until November 2006, exactly 30 years after the closing ceremony.[7]
But the Montreal story most relevant to LA’s situation is not the stadium that swallowed a city’s finances. It’s the transportation investments that didn’t happen.
When Montreal won the bid in 1970, the city had ambitious plans for transportation modernization. The Metro had opened in 1966 with just 26 stations; expansion was already planned. The original Olympic budget included CAD $2.8 billion for transportation improvements — airport modernization, highway upgrades, and Metro extensions.
As costs spiraled, the transportation program was systematically cannibalized. Resources that were supposed to extend the Metro were redirected to the stadium. Highway improvements were deferred. Airport upgrades were scaled back. By the time the Games arrived, Montreal had spent its capital budget on a stadium it couldn’t afford, while the transportation investments that would have served the city for decades were abandoned.
The Mobility Economics Lesson: Montreal violated the opportunity cost principle in the most devastating way possible. The city sacrificed permanent, high-value infrastructure to finance temporary, low-value spectacle. The stadium has required perpetual subsidies — Quebec just announced another $870 million to replace the roof for the third time.[8] The Metro extensions that weren’t built in 1976 weren’t completed until the 2000s.
This is the rarely discussed risk of Olympic investment: not that you build the wrong thing, but that you don’t build the right thing because the wrong thing consumes all available resources.
Jean Drapeau’s Folly
Montreal’s Olympic disaster has a name attached: Mayor Jean Drapeau. Drapeau personally championed the stadium’s extravagant design despite warnings about costs. When costs escalated, he chose to sacrifice transportation investments rather than scale back the stadium. The provincial government ultimately had to bail out the city, but by then the tradeoffs were locked in. No one was held accountable — Drapeau remained mayor until 1986.
The lesson for LA: political accountability matters. When one person’s vision overrides collective judgment, disaster follows. LA’s Olympic investments are being made by a complex multi-jurisdictional process. A Games Mobility Executive (GME) working group has been formed. GME is led by Metro, and consists of members from Metro, Regional Rail (Metrolink), City (Mayor’s Office & LADOT), LA28, SCAG, and CALTRANS (State). This diffusion of authority creates coordination challenges, but it also provides checks against any single actor’s hubris.
The question is whether LA’s process creates accountability or just creates opportunities for blame-shifting. Part 5 will map the actual decision-makers and their specific responsibilities.
LA’s Risk Factor: Moderate to High. LA’s transit expansion is funding-constrained. The March 2024 revision removed 11 projects from the “Twenty-Eight by ’28” list because funding couldn’t be secured. The Inglewood Transit Connector — originally a $2.4 billion automated people mover connecting the K Line to SoFi Stadium — collapsed entirely after federal and local funding was stripped. If Olympic-related costs escalate, what other projects get sacrificed?
Sochi 2014: Infrastructure Without Demand
Sochi is the reductio ad absurdum of Olympic transportation failure — a case study in what happens when infrastructure investment is completely decoupled from demand.
The 2014 Winter Games cost approximately $50 billion, making them the most expensive Olympics in history. Transportation consumed a staggering share: the road-railway connection between coastal venues in Sochi and mountain venues in Krasnaya Polyana cost $8.3–10 billion alone. Martin Muller, who has studied Sochi extensively, calculated that this represented the highest per-kilometer cost for rail construction worldwide.[9]
The infrastructure was technically impressive. The railway climbs from sea level to 600 meters through challenging terrain, with tunnels and viaducts that required genuine engineering innovation. During the Games, it worked flawlessly.
The problem: there was no demand for it outside the Games.
Post-Olympics, six trains per day operate in each direction — a schedule that wouldn’t justify a single-track branch line, let alone a $10 billion engineering marvel. Ticket prices are regulated at 112 rubles, but the actual operating cost per passenger is closer to 1,200 rubles. The gap is covered by perpetual subsidies that exceed $1.2 billion annually.
Sochi also illustrates the network effects failure. The railway connects two points — the coastal cluster and the mountain cluster — that had no significant travel demand between them before the Olympics and have no significant travel demand now. It doesn’t integrate into a broader regional network. It doesn’t serve commuters. It serves skiers, for a few months a year, most of whom drive.
The Mobility Economics Lesson: Sochi violated every principle simultaneously. Network Effects: The railway connects to nothing beyond Olympic venues. Demand Matching: Six trains per day reveals the absence of genuine demand. Operational Sustainability: Annual subsidies exceed $1.2 billion with no end in sight. Opportunity Cost: $50 billion could have modernized transportation across multiple Russian cities.
The deeper lesson is about purpose. Sochi was not designed to improve urban mobility. It was designed to project Russian state power on the global stage. The infrastructure was a political statement, not an economic investment. Evaluated on those terms, it may have succeeded — Putin got his spectacle. Evaluated as a transportation investment, it is an unmitigated catastrophe.
When Political Logic Overrides Economic Logic
Sochi represents the extreme case: transportation investment driven entirely by political considerations with no pretense of economic rationality. The road-railway connection was never expected to pay for itself. It was never expected to serve significant demand. It was built because Vladimir Putin wanted Russia to host the Winter Olympics, and hosting the Winter Olympics required connecting venues that no rational transportation planner would connect.
This is not LA’s situation — LA’s investments face genuine demand and serve existing corridors. But the Sochi case illuminates a subtler risk: deadline pressure overriding technical judgment. When the Olympic calendar dictates decisions, there’s pressure to build something — anything — that will be ready in time.
The Inglewood Transit Connector’s collapse may actually be a healthy sign: the region chose to abandon a project that couldn’t be delivered rather than force-marching something inadequate to completion. But that discipline must hold through 2028. The temptation to cut corners, skip proper planning, or accept suboptimal solutions to meet deadlines will intensify. LA’s decision-makers must resist — and citizens must hold them accountable for resisting.
LA’s Risk Factor: Low for the same failure mode, but the principle matters. LA’s investments are not being driven by state vanity projects. But they are being driven by a deadline — the Olympic “forcing function” — that may be causing planners to prioritize completion over optimization. Building the wrong thing fast is not better than building the right thing slow.
The Common Thread: Spectacle vs. Service
Across all four failures, a single variable separates what worked from what didn’t: whether the infrastructure served Olympic spectacle or urban service.
Athens’s metro served Athenians going to work. Athens’s canoe center served nobody.
Rio’s metro extensions (where they exist) carry passengers. Rio’s TransOlimpica carries memories.
Montreal’s stadium hosts occasional concerts. Montreal’s Metro — the parts that got built — moves 1.3 million passengers daily.
Sochi’s railway serves Russian state prestige. It doesn’t serve Russians.
The pattern is so consistent that it suggests a diagnostic rule: before any Olympic transportation investment, ask who will use it on an ordinary Tuesday in 2035. If the answer is “almost no one,” the investment will fail. If the answer is “the same people who would use it without the Olympics,” the investment may succeed.
This rule explains why Barcelona succeeded where others failed — a subject we’ll examine in detail in Part 3. Barcelona’s investments served Barcelonans. The Olympics were the catalyst, not the customer.
What This Means for LA
Let’s apply the diagnostic framework to LA’s Olympic transportation strategy.
Frank Ching offers an important clarification on LA’s approach: “It’s not exactly you say ‘Car-Free’, it’s transit priority policy that you can’t park at the venue because of Homeland Security reasons, then how do we bring people with authorized bus?”
This is a subtle but crucial distinction. LA is not attempting to eliminate driving — that would be delusional for a region spread across 1,400 square miles. Instead, it’s creating conditions where transit becomes the most convenient option for Olympic access, while accommodating drivers at strategically located park-and-ride facilities.
“We’re looking at about 100,000 park and ride spaces in remote and less congested locations, for those 60 days of time,” Ching notes. That’s not car-free; that’s car-managed.
Purple Line Extension to Westwood: Who uses it on a Tuesday in 2035? Answer: UCLA students, Westwood office workers, Century City commuters, medical center patients — hundreds of thousands of people with genuine daily travel needs. Verdict: Likely success.
K Line (Crenshaw/LAX): Who uses it on a Tuesday in 2035? Answer: LAX travelers, Inglewood residents, South LA commuters connecting to the broader network. Verdict: Likely success.
Regional Connector: Who uses it on a Tuesday in 2035? Answer: Everyone transferring between the A, E, and L lines — the connector eliminates transfers that previously added 20 minutes to trips. Verdict: Already succeeding.
Bus Surge (2,700 buses, 10,000 new staff, 15 staging depots): Who uses it on a Tuesday in 2035? Answer: Uncertain. If the surge buses serve routes that become permanent, success. If they serve Olympic-specific corridors that disappear after the Games, failure. Verdict: Depends on post-Games commitment.
Inglewood Transit Connector (cancelled): Who would have used it on a Tuesday in 2035? Answer: SoFi Stadium and Intuit Dome event attendees — but those are event-specific trips, not daily commutes. The connector’s cancellation may actually be a blessing; it forces the region to solve first/last mile with flexible solutions rather than dedicated infrastructure. Verdict: Bullet dodged, possibly.
Park-and-Ride Sites (25 planned): Who uses them on a Tuesday in 2035? Answer: Depends entirely on whether they’re located at natural park-and-ride catchment areas or at Olympic venue perimeters. Verdict: Unknown.
The Warning Signs
Based on the failure patterns we’ve examined, here are the warning signs that LA should monitor.
Frank Ching shares what his CEO told him when LA’s Olympic planning began: “Don’t forget people need to go to work and people still need to move around. The Angelenos still need to move around. Not just the people that you serve and bring me money, but also the people that you have to take care of and not to upset them.”
This guidance — prioritizing residents alongside visitors — is precisely what Rio forgot. TransOlimpica served Olympic spectators while ignoring the daily mobility needs of Cariocas. If LA’s Olympic transportation creates friction for residents, political support will evaporate.
Warning Sign #1: Route Selection Based on Venue Proximity
Rio’s TransOlimpica failed because it connected venues, not people. Any LA investment justified primarily by “serving Olympic venues” rather than “serving regional travel demand” should face intense scrutiny.
Warning Sign #2: Temporary Infrastructure Without Conversion Plans
Montreal sacrificed permanent investment for a temporary spectacle. LA’s bus surge is explicitly temporary — 2,700 borrowed buses that return to their home agencies after the Games. Unless there’s a plan to convert surge capacity into permanent service improvements, this is a $700 million to $1 billion expenditure with zero lasting value.
Warning Sign #3: Funding Gaps Filled by Deferring Other Projects
The 11 projects removed from “Twenty-Eight by ’28” are the canary in the coal mine. If Olympic pressure causes resources to flow toward deadline-driven projects at the expense of higher-value but non-Olympic projects, LA is walking the Montreal path.
Warning Sign #4: Optimistic Ridership Projections
Rio’s TransOlimpica projected 70,000 daily riders and achieved 25,000. LA Metro’s pre-pandemic ridership projections have consistently overstated actual performance. Any projection that assumes “the Games will change behavior permanently” should be treated with extreme skepticism. Behavior change is possible — but it requires sustained service quality, not Olympic enthusiasm.
Warning Sign #5: Political Pressure Overriding Technical Judgment
Sochi’s $50 billion price tag reflects what happens when political imperatives overwhelm engineering rationality. LA’s Olympic preparations are being driven by a hard deadline that creates intense pressure to finish something, even if that something isn’t optimal. The Inglewood Transit Connector’s collapse suggests this pressure is real.
The Counterfactual Question
Here is the question that separates successful Olympic investments from failures: Would this investment make sense without the Olympics?
Athens’s metro: Yes. It serves 1.4 million daily riders because Athens needed a metro, Olympics or not.
Rio’s TransOlimpica: No. The corridor connects Olympic venues, not population centers. Without the Games, it never would have been built — and probably shouldn’t have been.
Sochi’s railway: Absolutely not. No rational transportation planner would spend $10 billion to connect a Black Sea resort to a ski area with six daily trains.
For LA, the answer varies by project. The Purple Line, the K Line, and the Regional Connector all pass the counterfactual test — these are investments that would make sense without an Olympic deadline. The bus surge and temporary venue infrastructure do not. The healthier the “yes” column, the more likely LA’s Olympic investment produces lasting value. The larger the “no” column, the more likely LA joins the losers’ bracket.
From Failure Analysis to Accountability Framework
The four failures we’ve examined share a common thread: in each case, specific decision-makers made specific choices that led to predictable consequences. Athens chose venues over maintenance. Rio chose developer interests over rider demand. Montreal chose spectacle over transportation. Sochi chose political prestige over economic rationality.
LA faces analogous choices in the coming months:
Will Metro commit to post-Games service levels, or leave that question unanswered? Will bus-only lanes become permanent, or revert to traffic when the cameras leave? Will the LAX APM be supported by pricing that makes transit the obvious choice, or undermined by free curb access that perpetuates congestion? Will park-and-ride sites become housing, or remain surface parking in perpetuity?
These are not abstract questions. They are decisions that will be made by specific people at specific times. Part 5 of this series will identify those people, those times, and the pressure points that can influence outcomes.
But first, we need to understand what success looks like. That requires examining the one city that got it right: Barcelona.
Frequently Asked Questions
The four criteria are: (1) Network Effects — does the investment connect to existing infrastructure and population centers? (2) Demand Matching — does it serve genuine, sustained travel demand or just event spectacle? (3) Operational Sustainability — can it be maintained at reasonable cost after the event ends? (4) Opportunity Cost — what else could have been built with the same resources? Every failed Olympic transportation investment violates at least one of these principles. Sochi violated all four simultaneously.
Athens has a bifurcated legacy. Its transportation investments — metro, suburban rail, tram, ring road — were successful and continue serving 1.56 million daily riders. These investments served genuine demand that existed before and after the Olympics. However, the sporting venues became catastrophic white elephants. The canoe/kayak center is abandoned, the beach volleyball stadium is overgrown, and 2–3% of Greek sovereign debt was attributable to Olympic costs. The lesson: infrastructure that creates daily users creates political pressure for maintenance. Infrastructure that serves 17 days of spectacle has no constituency.
Rio’s TransOlimpica BRT corridor was designed to connect Olympic venues in Deodoro and Barra da Tijuca, not to serve the population centers where Cariocas actually live. Only 1.4% of Rio’s population lives within 1 kilometer of TransOlimpica stations. Ridership hit 25,000 daily against a 70,000 projection. Today, 46 stations are shuttered, and only 120 buses remain operational across the system. The resources would have been better spent extending the metro to densely populated areas. The core failure: the route was determined by venue locations and real estate developer interests, not by actual travel demand.
The “Tuesday Test” is Parkonomics’ diagnostic framework: before approving any Olympic transportation investment, ask who will use it on an ordinary Tuesday in 2035 — a decade after the Games. If the answer is “the same people who would use it without the Olympics” (commuters, students, airport travelers), the investment will likely succeed. If the answer is “almost no one,” the investment will likely fail. This test explains Athens’s metro (serves daily commuters — success), Rio’s TransOlimpica (serves no one post-Games — failure), and helps evaluate LA’s portfolio: the Purple Line passes; the bus surge, as currently planned, does not.
Montreal’s key lesson is about opportunity cost — the risk of not building the right thing because the wrong thing consumes all available resources. Montreal sacrificed CAD $2.8 billion in planned Metro extensions, highway upgrades, and airport improvements to cover stadium cost overruns. The Metro extensions abandoned in 1976 weren’t completed until the 2000s. LA faces analogous risk: 11 projects have already been removed from the “Twenty-Eight by ’28” list due to funding constraints. If Olympic-related costs escalate, the question is which additional projects get deferred — and whether those deferrals set back LA’s transit development by decades.
Based on the failure patterns from Athens, Rio, Montreal, and Sochi: (1) Route selection based on venue proximity rather than population demand — the Rio trap. (2) Temporary infrastructure without conversion plans — 2,700 borrowed buses with no plan for permanent service improvements. (3) Funding gaps filled by deferring other projects — 11 projects already removed from “Twenty-Eight by ’28.” (4) Optimistic ridership projections that assume the Games will permanently change behavior — Rio projected 70K, got 25K. (5) Political pressure overriding technical judgment — deadline pressure to finish something, even if suboptimal.
Sources
Athens
- Elliniko Metro S.A., “Transit in Athens” (2024).
- Bechtel Corporation, “Athens Metro Project Documentation.”
- Inside the Games, “Athens 2004: The Squandered Legacy” (2023).
Rio
- Institute for Transportation and Development Policy, “TransOlimpica BRT Rating Analysis” (2017).
- Gaffney, C. “Gentrification and Mega-Events in Rio de Janeiro.” Journal of Urban Affairs, 2016.
- RioOnWatch, “Rio’s BRT System: A Tool for Legacy or Fragmentation?” (2016).
Montreal
- Council on Foreign Relations, “The Economics of Hosting the Olympic Games” (2024).
- The B1M, “Canada’s $2BN Olympic Nightmare is Still Not Over” (2023).
Sochi
- Muller, M. “After Sochi 2014: Costs and Impacts of Russia’s Olympic Games.” Eurasian Geography and Economics, 2015. 55(6): 628-655.
- Muller, M. “The Mega-Event Syndrome.” Journal of the American Planning Association, 2015. 81(1): 6-17.
Cross-Cutting